
G-III Apparel Group, LTD. (GIII): Price and Financial Metrics
GIII Price/Volume Stats
| Current price | $31.71 | 52-week high | $35.68 |
| Prev. close | $32.09 | 52-week low | $13.59 |
| Day low | $31.36 | Volume | 313,700 |
| Day high | $32.03 | Avg. volume | 528,009 |
| 50-day MA | $31.90 | Dividend yield | N/A |
| 200-day MA | $24.41 | Market Cap | 1.45B |
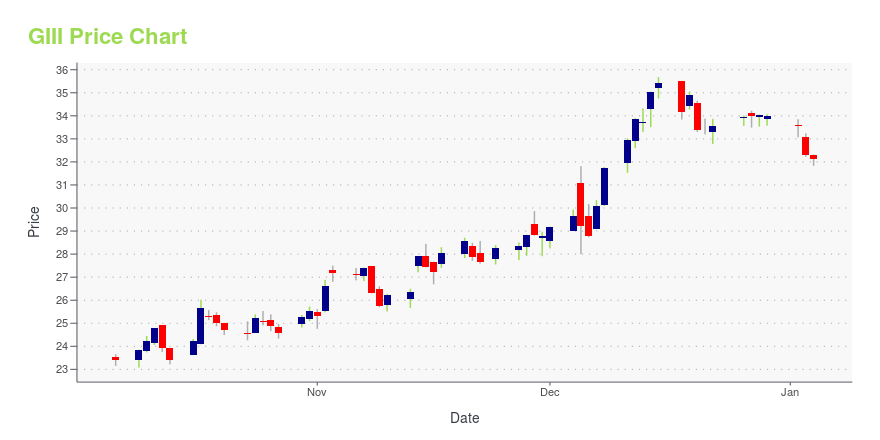
GIII Stock Price Chart Interactive Chart >
GIII POWR Grades
- Value is the dimension where GIII ranks best; there it ranks ahead of 96.84% of US stocks.
- GIII's strongest trending metric is Growth; it's been moving up over the last 26 weeks.
- GIII's current lowest rank is in the Stability metric (where it is better than 8.83% of US stocks).

GIII Stock Summary
- The price/operating cash flow metric for G III APPAREL GROUP LTD is higher than only 8.35% of stocks in our set with a positive cash flow.
- With a year-over-year growth in debt of -37.12%, G III APPAREL GROUP LTD's debt growth rate surpasses merely 8.42% of about US stocks.
- G III APPAREL GROUP LTD's shareholder yield -- a measure of how much capital is returned to stockholders via dividends and buybacks -- is 31.05%, greater than the shareholder yield of 94.22% of stocks in our set.
- Stocks with similar financial metrics, market capitalization, and price volatility to G III APPAREL GROUP LTD are APEI, ARKR, MHK, UAMY, and CNET.
- Visit GIII's SEC page to see the company's official filings. To visit the company's web site, go to www.giii.com.
GIII Valuation Summary
- GIII's price/earnings ratio is -13.7; this is 178.29% lower than that of the median Consumer Cyclical stock.
- Over the past 243 months, GIII's EV/EBIT ratio has gone down 46.

Below are key valuation metrics over time for GIII.
| Stock | Date | P/S | P/B | P/E | EV/EBIT |
|---|---|---|---|---|---|
| GIII | 2023-12-29 | 0.5 | 1 | -13.7 | -38.9 |
| GIII | 2023-12-28 | 0.5 | 1 | -13.7 | -38.9 |
| GIII | 2023-12-27 | 0.5 | 1 | -13.7 | -38.9 |
| GIII | 2023-12-26 | 0.5 | 1 | -13.6 | -38.8 |
| GIII | 2023-12-22 | 0.5 | 1 | -13.5 | -38.5 |
| GIII | 2023-12-21 | 0.5 | 1 | -13.5 | -38.6 |
GIII Growth Metrics
- Its 2 year cash and equivalents growth rate is now at -28.85%.
- Its 4 year net cashflow from operations growth rate is now at 128.27%.
- Its 4 year cash and equivalents growth rate is now at 817.84%.
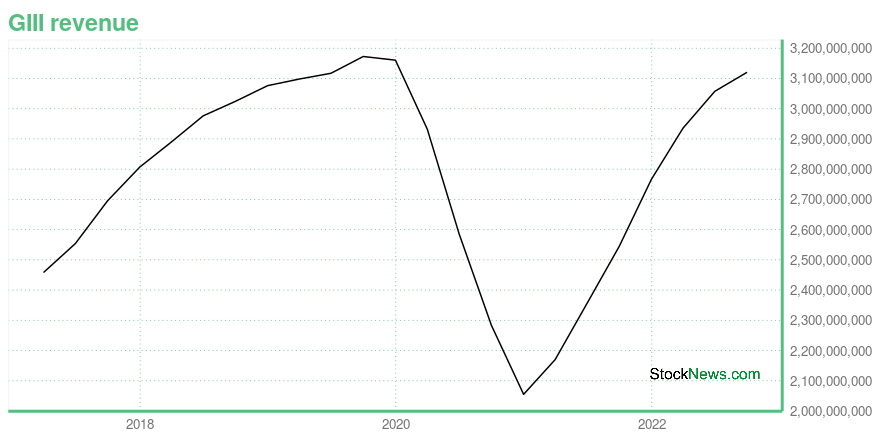
The table below shows GIII's growth in key financial areas (numbers in millions of US dollars).
| Date | Revenue | Operating Cash Flow | Net Income to Common Stock |
|---|---|---|---|
| 2022-09-30 | 3,120.455 | -214.144 | 176.486 |
| 2022-06-30 | 3,057.548 | -117.922 | 222.057 |
| 2022-03-31 | 2,935.385 | 149.925 | 204.906 |
| 2021-12-31 | 2,766.538 | 185.798 | 200.593 |
| 2021-09-30 | 2,544.625 | 186.941 | 166.805 |
| 2021-06-30 | 2,355.794 | 208.779 | 123.305 |
GIII's Quality Factors
The “Quality” component of the POWR Ratings focuses on 31 different factors of a companies fundamentals and operational strength. Here are some key insights as we drill into the specifics of these quality attributes.- GIII has a Quality Grade of C, ranking ahead of 70.24% of graded US stocks.
- GIII's asset turnover comes in at 0.956 -- ranking 19th of 32 Apparel stocks.
- LEVI, SKX, and COLM are the stocks whose asset turnover ratios are most correlated with GIII.

The table below shows GIII's key quality metrics over time.
| Period | Asset Turnover | Gross Margin | ROIC |
|---|---|---|---|
| 2021-07-31 | 0.956 | 0.371 | 0.139 |
| 2021-04-30 | 0.907 | 0.376 | 0.110 |
| 2021-01-31 | 0.824 | 0.362 | 0.048 |
| 2020-10-31 | 0.904 | 0.354 | 0.048 |
| 2020-07-31 | 0.979 | 0.352 | 0.062 |
| 2020-04-30 | 1.066 | 0.343 | 0.073 |
GIII Price Target
For more insight on analysts targets of GIII, see our GIII price target page. And for a list of of all stocks sorted by upside potential based on analyst target price, see our Top Price Target page.
| Average Price Target | $38.43 | Average Broker Recommendation | 1.86 (Hold) |
G-III Apparel Group, LTD. (GIII) Company Bio
G-III Apparel Group is a leading manufacturer and distributor of outerwear, dresses, sportswear, swimwear, women's suits, women's performance wear, footwear, luggage, women's handbags, small leather goods and cold weather accessories under licensed brands, owned brands and private label brands. The company was founded in 1879 and is based in New York, New York.
Latest GIII News From Around the Web
Below are the latest news stories about G III APPAREL GROUP LTD that investors may wish to consider to help them evaluate GIII as an investment opportunity.
The Zacks Analyst Blog Highlights Splunk, Workday, NVIDIA, G-III Apparel Group and Casey's General StoresSplunk, Workday, NVIDIA, G-III Apparel Group and Casey's General Stores are part of the Zacks top Analyst Blog. |
Zacks.com featured highlights include G-III Apparel, United States Cellular and FrontdoorG-III Apparel, United States Cellular and Frontdoor are part of the Zacks Screen of the Week article. |
Is GIII Apparel Group (GIII) Stock Outpacing Its Consumer Discretionary Peers This Year?Here is how G-III Apparel Group (GIII) and Royal Caribbean (RCL) have performed compared to their sector so far this year. |
3 Momentum Anomaly Stocks to Buy as Santa Claus Rally ContinuesG-III Apparel (GIII), U.S. Cellular (USM) and Frontdoor (FTDR) are currently witnessing a short-term pullback in price. So, make sure you take full advantage of it. |
Why Fast-paced Mover G-III Apparel (GIII) Is a Great Choice for Value InvestorsG-III Apparel (GIII) made it through our 'Fast-Paced Momentum at a Bargain' screen and could be a great choice for investors looking for stocks that have gained strong momentum recently but are still trading at reasonable prices. |
GIII Price Returns
| 1-mo | 6.05% |
| 3-mo | 13.70% |
| 6-mo | 65.41% |
| 1-year | 91.60% |
| 3-year | 11.34% |
| 5-year | -12.45% |
| YTD | -6.68% |
| 2023 | 147.85% |
| 2022 | -50.40% |
| 2021 | 16.43% |
| 2020 | -29.13% |
| 2019 | 20.11% |
Continue Researching GIII
Want to see what other sources are saying about G Iii Apparel Group Ltd's financials and stock price? Try the links below:G Iii Apparel Group Ltd (GIII) Stock Price | Nasdaq
G Iii Apparel Group Ltd (GIII) Stock Quote, History and News - Yahoo Finance
G Iii Apparel Group Ltd (GIII) Stock Price and Basic Information | MarketWatch
Loading social stream, please wait...