
Patrick Industries, Inc. (PATK): Price and Financial Metrics
PATK Price/Volume Stats
| Current price | $111.20 | 52-week high | $113.59 |
| Prev. close | $110.91 | 52-week low | $63.57 |
| Day low | $109.12 | Volume | 204,300 |
| Day high | $111.61 | Avg. volume | 134,615 |
| 50-day MA | $99.07 | Dividend yield | 1.98% |
| 200-day MA | $82.97 | Market Cap | 2.46B |
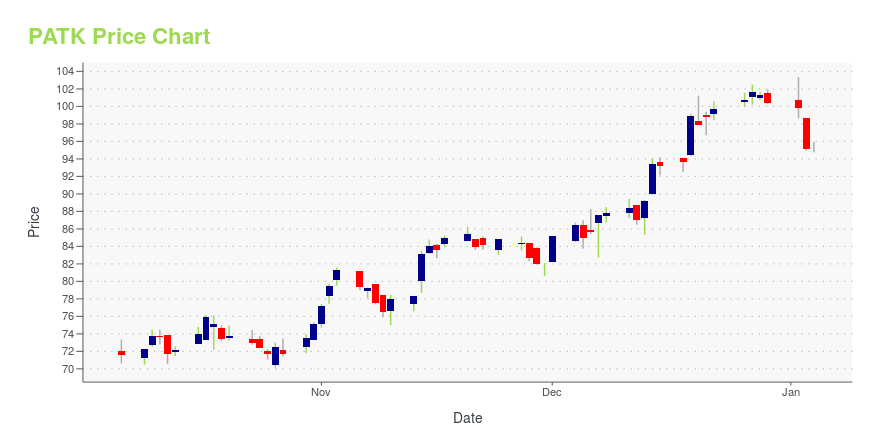
PATK Stock Price Chart Interactive Chart >
PATK POWR Grades
- PATK scores best on the Quality dimension, with a Quality rank ahead of 82.48% of US stocks.
- The strongest trend for PATK is in Momentum, which has been heading down over the past 26 weeks.
- PATK's current lowest rank is in the Momentum metric (where it is better than 32.8% of US stocks).

PATK Stock Summary
- The capital turnover (annual revenue relative to shareholder's equity) for PATK is 3.53 -- better than 85% of US stocks.
- As for revenue growth, note that PATK's revenue has grown -28.33% over the past 12 months; that beats the revenue growth of merely 9.68% of US companies in our set.
- PATRICK INDUSTRIES INC's shareholder yield -- a measure of how much capital is returned to stockholders via dividends and buybacks -- is 14.97%, greater than the shareholder yield of 88.7% of stocks in our set.
- If you're looking for stocks that are quantitatively similar to PATRICK INDUSTRIES INC, a group of peers worth examining would be ACCO, THO, ABM, ATKR, and AMN.
- Visit PATK's SEC page to see the company's official filings. To visit the company's web site, go to www.patrickind.com.
PATK Valuation Summary
- PATK's price/sales ratio is 0.6; this is 25% lower than that of the median Consumer Cyclical stock.
- PATK's price/earnings ratio has moved up 13.9 over the prior 243 months.

Below are key valuation metrics over time for PATK.
| Stock | Date | P/S | P/B | P/E | EV/EBIT |
|---|---|---|---|---|---|
| PATK | 2023-12-29 | 0.6 | 2.2 | 14.6 | 12.9 |
| PATK | 2023-12-28 | 0.6 | 2.2 | 14.7 | 13.0 |
| PATK | 2023-12-27 | 0.6 | 2.2 | 14.8 | 13.0 |
| PATK | 2023-12-26 | 0.6 | 2.2 | 14.6 | 12.9 |
| PATK | 2023-12-22 | 0.6 | 2.1 | 14.5 | 12.9 |
| PATK | 2023-12-21 | 0.6 | 2.1 | 14.4 | 12.8 |
PATK Growth Metrics
- Its 2 year cash and equivalents growth rate is now at -32.45%.
- The 2 year price growth rate now stands at 66.01%.
- The 4 year cash and equivalents growth rate now stands at 765.67%.
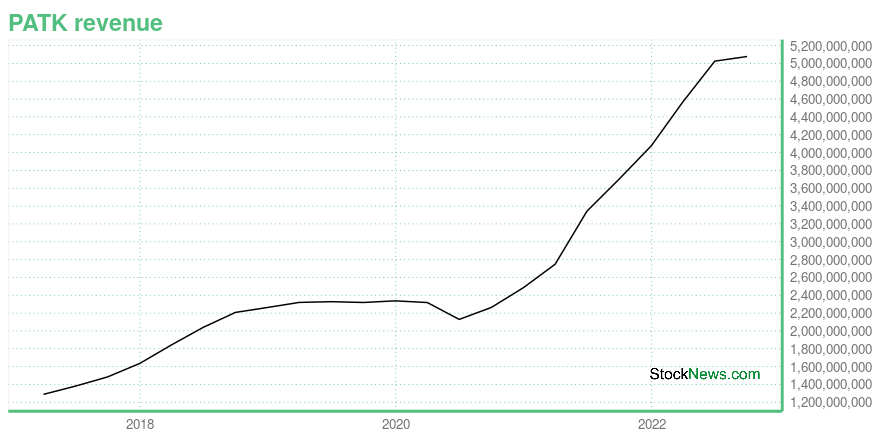
The table below shows PATK's growth in key financial areas (numbers in millions of US dollars).
| Date | Revenue | Operating Cash Flow | Net Income to Common Stock |
|---|---|---|---|
| 2022-09-30 | 5,077.436 | 334.521 | 349.036 |
| 2022-06-30 | 5,025.524 | 247.681 | 347.614 |
| 2022-03-31 | 4,569.784 | 178.799 | 290.075 |
| 2021-12-31 | 4,078.092 | 252.13 | 224.915 |
| 2021-09-30 | 3,703.226 | 194.812 | 201.719 |
| 2021-06-30 | 3,343.756 | 199.526 | 181.658 |
PATK's Quality Factors
The “Quality” component of the POWR Ratings focuses on 31 different factors of a companies fundamentals and operational strength. Here are some key insights as we drill into the specifics of these quality attributes.- PATK has a Quality Grade of C, ranking ahead of 39.16% of graded US stocks.
- PATK's asset turnover comes in at 1.81 -- ranking 4th of 60 Construction Materials stocks.
- DOOR, TREX, and GIFI are the stocks whose asset turnover ratios are most correlated with PATK.

The table below shows PATK's key quality metrics over time.
| Period | Asset Turnover | Gross Margin | ROIC |
|---|---|---|---|
| 2021-06-27 | 1.810 | 0.192 | 0.176 |
| 2021-03-28 | 1.651 | 0.186 | 0.141 |
| 2020-12-31 | 1.568 | 0.185 | 0.128 |
| 2020-09-27 | 1.494 | 0.184 | 0.116 |
| 2020-06-28 | 1.434 | 0.182 | 0.099 |
| 2020-03-29 | 1.606 | 0.184 | 0.130 |
PATK Price Target
For more insight on analysts targets of PATK, see our PATK price target page. And for a list of of all stocks sorted by upside potential based on analyst target price, see our Top Price Target page.
| Average Price Target | $113.25 | Average Broker Recommendation | 1.38 (Strong Buy) |
Patrick Industries, Inc. (PATK) Company Bio
Patrick Industries is a manufacturer of component products and distributor of building products serving the recreational vehicle, manufactured housing, kitchen cabinet, office and household furniture, fixtures and commercial furnishings, marine, and other industrial markets. The company was founded in 1959 and is based in Elkhart, Indiana.
Latest PATK News From Around the Web
Below are the latest news stories about PATRICK INDUSTRIES INC that investors may wish to consider to help them evaluate PATK as an investment opportunity.
Patrick Industries CEO Andy Nemeth Sells 20,000 SharesOn December 19, 2023, Andy Nemeth, CEO of Patrick Industries Inc (NASDAQ:PATK), sold 20,000 shares of the company's stock, according to a recent SEC Filing. |
ROCKFORD FOSGATE® APPOINTS ORA FREEMAN AS SENIOR DIRECTOR OF MARINE OEMRockford Fosgate, the industry leader in high-performance audio systems, is excited to announce the addition of Ora Freeman as Senior Director of OEM Marine. |
Patrick Industries (PATK) Surges 5.7%: Is This an Indication of Further Gains?Patrick Industries (PATK) was a big mover last session on higher-than-average trading volume. The latest trend in earnings estimate revisions might not help the stock continue moving higher in the near term. |
Insider Sell: CEO Andy Nemeth Sells 10,000 Shares of Patrick Industries Inc (PATK)Patrick Industries Inc (NASDAQ:PATK) has recently witnessed a significant insider sell that has caught the attention of investors and market analysts. |
Patrick Industries, Inc. Publishes 2023 Sustainability & Responsibility ReportPatrick Industries, Inc. (NASDAQ: PATK) ("Patrick" or the "Company"), a leading component solutions provider for the Outdoor Enthusiast and Housing markets, today announced the publication of its 2023 Sustainability & Responsibility Report. |
PATK Price Returns
| 1-mo | 13.77% |
| 3-mo | 34.04% |
| 6-mo | 39.13% |
| 1-year | 53.62% |
| 3-year | 45.10% |
| 5-year | 159.99% |
| YTD | 11.36% |
| 2023 | 69.62% |
| 2022 | -23.07% |
| 2021 | 19.72% |
| 2020 | 32.77% |
| 2019 | 77.91% |
PATK Dividends
| Ex-Dividend Date | Type | Payout Amount | Change | ||||||
|---|---|---|---|---|---|---|---|---|---|
| Loading, please wait... | |||||||||
Continue Researching PATK
Want to see what other sources are saying about Patrick Industries Inc's financials and stock price? Try the links below:Patrick Industries Inc (PATK) Stock Price | Nasdaq
Patrick Industries Inc (PATK) Stock Quote, History and News - Yahoo Finance
Patrick Industries Inc (PATK) Stock Price and Basic Information | MarketWatch
Loading social stream, please wait...