
Nexstar Media Group, Inc. - (NXST): Price and Financial Metrics
NXST Price/Volume Stats
| Current price | $173.77 | 52-week high | $200.83 |
| Prev. close | $173.87 | 52-week low | $132.30 |
| Day low | $171.66 | Volume | 405,800 |
| Day high | $174.86 | Avg. volume | 311,767 |
| 50-day MA | $164.57 | Dividend yield | 3.89% |
| 200-day MA | $158.49 | Market Cap | 5.90B |
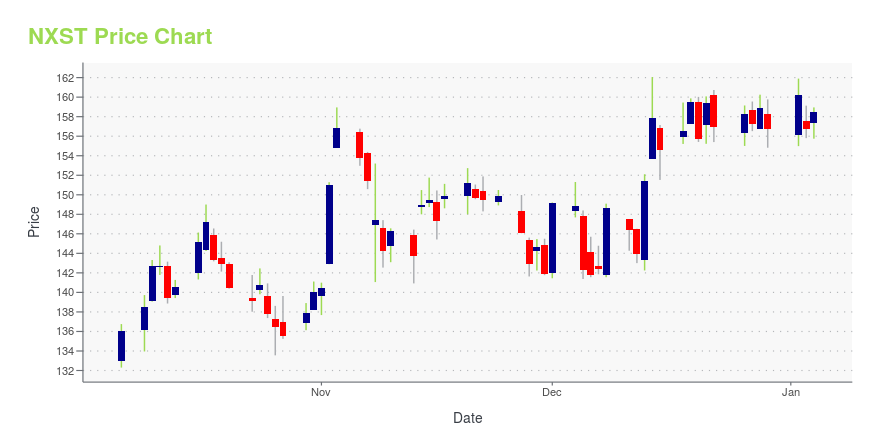
NXST Stock Price Chart Interactive Chart >
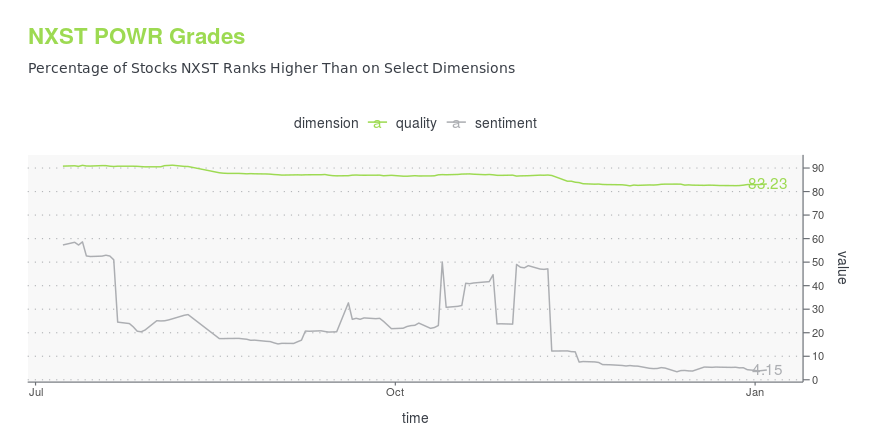
NXST POWR Grades
- Quality is the dimension where NXST ranks best; there it ranks ahead of 83.23% of US stocks.
- The strongest trend for NXST is in Quality, which has been heading down over the past 26 weeks.
- NXST ranks lowest in Sentiment; there it ranks in the 4th percentile.
NXST Stock Summary
- Price to trailing twelve month operating cash flow for NXST is currently 5.14, higher than only 21.53% of US stocks with positive operating cash flow.
- NXST's equity multiplier -- a measure of assets relative to shareholders'equity -- is greater than that of 78.33% of US stocks.
- NEXSTAR MEDIA GROUP INC's shareholder yield -- a measure of how much capital is returned to stockholders via dividends and buybacks -- is 23.88%, greater than the shareholder yield of 92.73% of stocks in our set.
- Stocks with similar financial metrics, market capitalization, and price volatility to NEXSTAR MEDIA GROUP INC are BYD, AGO, SPNT, NWE, and SUM.
- Visit NXST's SEC page to see the company's official filings. To visit the company's web site, go to www.nexstar.tv.
NXST Valuation Summary
- In comparison to the median Communication Services stock, NXST's price/sales ratio is 9.09% lower, now standing at 1.
- NXST's price/sales ratio has moved down 0.8 over the prior 243 months.

Below are key valuation metrics over time for NXST.
| Stock | Date | P/S | P/B | P/E | EV/EBIT |
|---|---|---|---|---|---|
| NXST | 2023-12-29 | 1.0 | 2.3 | 12.2 | 11.8 |
| NXST | 2023-12-28 | 1.1 | 2.3 | 12.4 | 11.9 |
| NXST | 2023-12-27 | 1.0 | 2.3 | 12.3 | 11.8 |
| NXST | 2023-12-26 | 1.1 | 2.3 | 12.3 | 11.9 |
| NXST | 2023-12-22 | 1.0 | 2.3 | 12.2 | 11.8 |
| NXST | 2023-12-21 | 1.1 | 2.3 | 12.4 | 11.9 |
NXST Growth Metrics
- Its 5 year net cashflow from operations growth rate is now at 275.95%.
- Its 5 year revenue growth rate is now at 152.51%.
- The year over year cash and equivalents growth rate now stands at -4.09%.

The table below shows NXST's growth in key financial areas (numbers in millions of US dollars).
| Date | Revenue | Operating Cash Flow | Net Income to Common Stock |
|---|---|---|---|
| 2022-12-31 | 5,211 | 1,403 | 971.1 |
| 2022-09-30 | 4,970.138 | 1,518.189 | 1,031.793 |
| 2022-06-30 | 4,858.05 | 1,428.286 | 912.657 |
| 2022-03-31 | 4,744.54 | 1,285.488 | 885.261 |
| 2021-12-31 | 4,648.371 | 1,214.843 | 834.568 |
| 2021-09-30 | 4,779.144 | 1,258.336 | 934.822 |
NXST's Quality Factors
The “Quality” component of the POWR Ratings focuses on 31 different factors of a companies fundamentals and operational strength. Here are some key insights as we drill into the specifics of these quality attributes.- NXST has a Quality Grade of B, ranking ahead of 78.72% of graded US stocks.
- NXST's asset turnover comes in at 0.356 -- ranking 38th of 64 Communication stocks.
- SBGI, MARK, and IDT are the stocks whose asset turnover ratios are most correlated with NXST.

The table below shows NXST's key quality metrics over time.
| Period | Asset Turnover | Gross Margin | ROIC |
|---|---|---|---|
| 2021-06-30 | 0.356 | 0.626 | 0.140 |
| 2021-03-31 | 0.338 | 0.619 | 0.128 |
| 2020-12-31 | 0.335 | 0.618 | 0.126 |
| 2020-09-30 | 0.311 | 0.592 | 0.099 |
| 2020-06-30 | 0.273 | 0.570 | 0.080 |
| 2020-03-31 | 0.288 | 0.572 | 0.086 |
NXST Price Target
For more insight on analysts targets of NXST, see our NXST price target page. And for a list of of all stocks sorted by upside potential based on analyst target price, see our Top Price Target page.
| Average Price Target | $180.89 | Average Broker Recommendation | 1.28 (Strong Buy) |
Nexstar Media Group, Inc. - (NXST) Company Bio
Nexstar Broadcasting Group operates as a television broadcasting and digital media company in the United States. The company was founded in 1996 and is based in Irving, Texas.
Latest NXST News From Around the Web
Below are the latest news stories about NEXSTAR MEDIA GROUP INC that investors may wish to consider to help them evaluate NXST as an investment opportunity.
Nexstar Media Group Inc EVP, Station Operations Blake Russell Sells 5,243 SharesBlake Russell, EVP, Station Operations of Nexstar Media Group Inc (NASDAQ:NXST), executed a sale of 5,243 shares in the company on December 26, 2023, according to a SEC Filing. |
Director Charles Mcmillen Sells 1,000 Shares of Nexstar Media Group IncCharles Mcmillen, a director at Nexstar Media Group Inc (NASDAQ:NXST), sold 1,000 shares of the company on December 22, 2023, according to a recent SEC Filing. |
Director ARMSTRONG D GEOFFREY Sells Shares of Nexstar Media Group IncOn December 20, 2023, ARMSTRONG D GEOFFREY, a director at Nexstar Media Group Inc, executed a sale of 3,625 shares of the company's stock, as reported in a recent SEC Filing. |
Nexstar Media Group Extends Employment Agreement With Lee Ann Gliha, Executive Vice President and Chief Financial OfficerIRVING, Texas, December 20, 2023--Nexstar Media Group entered into an extension of its employment agreement with Executive Vice President and Chief Financial Officer, Lee Ann Gliha. |
Nexstar Television Stations in Grand Rapids, Sioux Falls, and Panama City to Begin Carrying CW Network Programming on January 1IRVING, Texas, December 18, 2023--Nexstar Media Group, Inc. (NASDAQ: NXST), today announced that beginning January 1, 2024, its television stations in Grand Rapids, Michigan, Sioux Falls, South Dakota, and Panama City, Florida, will begin carrying the primetime entertainment and live sports programming of The CW Network on one of their related digital subchannels. |
NXST Price Returns
| 1-mo | 1.80% |
| 3-mo | 17.37% |
| 6-mo | 13.10% |
| 1-year | -10.00% |
| 3-year | 50.63% |
| 5-year | 116.26% |
| YTD | 12.05% |
| 2023 | -7.52% |
| 2022 | 18.37% |
| 2021 | 40.95% |
| 2020 | -4.42% |
| 2019 | 51.93% |
NXST Dividends
| Ex-Dividend Date | Type | Payout Amount | Change | ||||||
|---|---|---|---|---|---|---|---|---|---|
| Loading, please wait... | |||||||||
Continue Researching NXST
Want to do more research on Nexstar Media Group Inc's stock and its price? Try the links below:Nexstar Media Group Inc (NXST) Stock Price | Nasdaq
Nexstar Media Group Inc (NXST) Stock Quote, History and News - Yahoo Finance
Nexstar Media Group Inc (NXST) Stock Price and Basic Information | MarketWatch
Loading social stream, please wait...