
Thermo Fisher Scientific Inc. (TMO): Price and Financial Metrics
TMO Price/Volume Stats
| Current price | $547.84 | 52-week high | $593.17 |
| Prev. close | $548.57 | 52-week low | $415.60 |
| Day low | $546.32 | Volume | 1,028,200 |
| Day high | $552.69 | Avg. volume | 1,867,288 |
| 50-day MA | $536.10 | Dividend yield | 0.26% |
| 200-day MA | $518.02 | Market Cap | 211.67B |
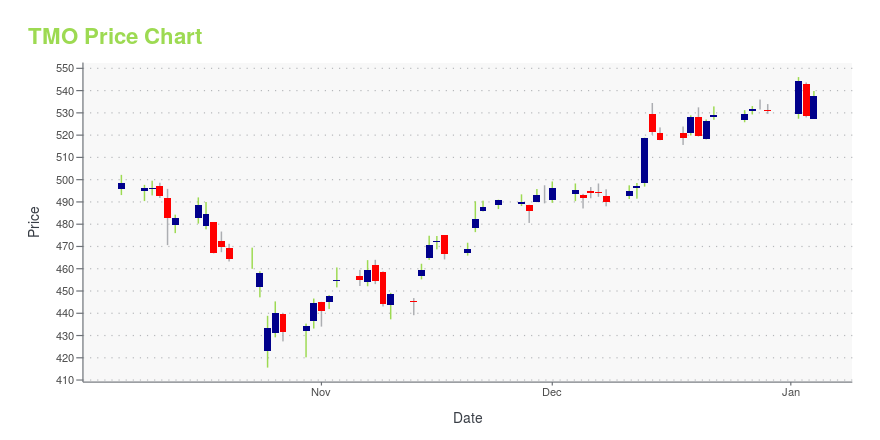
TMO Stock Price Chart Interactive Chart >
TMO POWR Grades
- Sentiment is the dimension where TMO ranks best; there it ranks ahead of 95.05% of US stocks.
- TMO's strongest trending metric is Growth; it's been moving up over the last 26 weeks.
- TMO ranks lowest in Momentum; there it ranks in the 27th percentile.

TMO Stock Summary
- TMO has a higher market value than 99.06% of US stocks; more precisely, its current market capitalization is $204,321,410,791.
- THERMO FISHER SCIENTIFIC INC's stock had its IPO on September 1, 1987, making it an older stock than 91.68% of US equities in our set.
- In terms of volatility of its share price, TMO is more volatile than merely 15.22% of stocks we're observing.
- If you're looking for stocks that are quantitatively similar to THERMO FISHER SCIENTIFIC INC, a group of peers worth examining would be ABT, DHR, SHEL, CMCSA, and TMUS.
- Visit TMO's SEC page to see the company's official filings. To visit the company's web site, go to www.thermofisher.com.
TMO Valuation Summary
- TMO's price/earnings ratio is 34.5; this is 18.35% higher than that of the median Healthcare stock.
- TMO's price/sales ratio has moved up 2.7 over the prior 243 months.

Below are key valuation metrics over time for TMO.
| Stock | Date | P/S | P/B | P/E | EV/EBIT |
|---|---|---|---|---|---|
| TMO | 2023-12-29 | 4.7 | 4.5 | 34.5 | 31.1 |
| TMO | 2023-12-28 | 4.7 | 4.5 | 34.7 | 31.3 |
| TMO | 2023-12-27 | 4.7 | 4.5 | 34.6 | 31.2 |
| TMO | 2023-12-26 | 4.7 | 4.5 | 34.4 | 31.1 |
| TMO | 2023-12-22 | 4.7 | 4.5 | 34.4 | 31.1 |
| TMO | 2023-12-21 | 4.7 | 4.5 | 34.2 | 30.9 |
TMO Growth Metrics
- Its 4 year price growth rate is now at 92.8%.
- Its 5 year net income to common stockholders growth rate is now at 69%.
- The year over year price growth rate now stands at 16.7%.
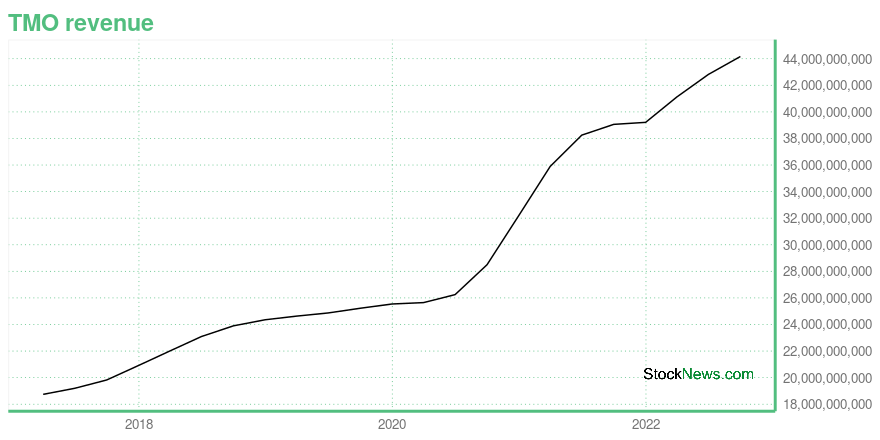
The table below shows TMO's growth in key financial areas (numbers in millions of US dollars).
| Date | Revenue | Operating Cash Flow | Net Income to Common Stock |
|---|---|---|---|
| 2022-09-30 | 44,167 | 8,124 | 7,032 |
| 2022-06-30 | 42,820 | 8,837 | 7,439 |
| 2022-03-31 | 41,123 | 9,536 | 7,603 |
| 2021-12-31 | 39,211 | 9,312 | 7,725 |
| 2021-09-30 | 39,059 | 10,194 | 8,565 |
| 2021-06-30 | 38,250 | 10,252 | 8,596 |
TMO's Quality Factors
The “Quality” component of the POWR Ratings focuses on 31 different factors of a companies fundamentals and operational strength. Here are some key insights as we drill into the specifics of these quality attributes.- TMO has a Quality Grade of C, ranking ahead of 62.66% of graded US stocks.
- TMO's asset turnover comes in at 0.574 -- ranking 43rd of 75 Measuring and Control Equipment stocks.
- PACB, PKI, and PRPO are the stocks whose asset turnover ratios are most correlated with TMO.

The table below shows TMO's key quality metrics over time.
| Period | Asset Turnover | Gross Margin | ROIC |
|---|---|---|---|
| 2021-07-03 | 0.574 | 0.513 | 0.323 |
| 2021-04-03 | 0.551 | 0.515 | 0.302 |
| 2020-12-31 | 0.509 | 0.497 | 0.244 |
| 2020-09-26 | 0.470 | 0.473 | 0.209 |
| 2020-06-27 | 0.446 | 0.454 | 0.166 |
| 2020-03-28 | 0.443 | 0.443 | 0.174 |
TMO Price Target
For more insight on analysts targets of TMO, see our TMO price target page. And for a list of of all stocks sorted by upside potential based on analyst target price, see our Top Price Target page.
| Average Price Target | $586.74 | Average Broker Recommendation | 1.36 (Strong Buy) |
Thermo Fisher Scientific Inc. (TMO) Company Bio
Thermo Fisher Scientific is an American provisioner of scientific instrumentation, reagents and consumables, and software and services to healthcare, life science, and other laboratories in academia, government, and industry (including in the biotechnology and pharmaceutical sectors). Based in Waltham, Massachusetts, Thermo Fisher was created in 2006 by the merger of Thermo Electron and Fisher Scientific, to form a company with US$ 9 billion in combined revenues. (Source:Wikipedia)
Latest TMO News From Around the Web
Below are the latest news stories about THERMO FISHER SCIENTIFIC INC that investors may wish to consider to help them evaluate TMO as an investment opportunity.
Thermo Fisher Scientific (TMO) Laps the Stock Market: Here's WhyIn the closing of the recent trading day, Thermo Fisher Scientific (TMO) stood at $531.65, denoting a +0.37% change from the preceding trading day. |
HSBC Sees Opportunity in These 2 Biopharma Giants Ahead of the 2024 ElectionsThe silly season is upon us. Not the holidays – but the election. We’re less than 11 months out from the Presidential vote, and the first primary, the Iowa GOP caucus, is less than 30 days away. Election years are the ‘known unknown’ of the US economy. We know they’re coming, we know the results can change everything, we know that every economic sector will react differently – but we never truly know how those changes will shake out. This cyclical truth of politics and financial markets informs |
Thermo Fisher (TMO) Unveils CorEvitas Pharmacovigilance PlatformThermo Fisher (TMO) introduces the CorEvitas pharmacovigilance platform for clinical research registries. |
Thermo Fisher Scientific's (NYSE:TMO) investors will be pleased with their impressive 139% return over the last five yearsThe most you can lose on any stock (assuming you don't use leverage) is 100% of your money. But on the bright side, if... |
Thermo Fisher's (TMO) PPD Business Backs BARDA's Clinical TrialThermo Fisher's (TMO) PPD clinical research business is selected by BARDA to support the Phase II platform clinical trial to treat ARDS. |
TMO Price Returns
| 1-mo | -0.71% |
| 3-mo | 13.64% |
| 6-mo | 0.61% |
| 1-year | -1.86% |
| 3-year | 15.20% |
| 5-year | 119.81% |
| YTD | 3.21% |
| 2023 | -3.36% |
| 2022 | -17.29% |
| 2021 | 43.54% |
| 2020 | 43.72% |
| 2019 | 45.55% |
TMO Dividends
| Ex-Dividend Date | Type | Payout Amount | Change | ||||||
|---|---|---|---|---|---|---|---|---|---|
| Loading, please wait... | |||||||||
Continue Researching TMO
Want to do more research on Thermo Fisher Scientific Inc's stock and its price? Try the links below:Thermo Fisher Scientific Inc (TMO) Stock Price | Nasdaq
Thermo Fisher Scientific Inc (TMO) Stock Quote, History and News - Yahoo Finance
Thermo Fisher Scientific Inc (TMO) Stock Price and Basic Information | MarketWatch
Loading social stream, please wait...