
Campbell Soup Co. (CPB): Price and Financial Metrics
CPB Price/Volume Stats
| Current price | $41.45 | 52-week high | $56.04 |
| Prev. close | $41.28 | 52-week low | $37.94 |
| Day low | $40.92 | Volume | 3,338,300 |
| Day high | $41.55 | Avg. volume | 2,734,624 |
| 50-day MA | $43.55 | Dividend yield | 3.57% |
| 200-day MA | $44.15 | Market Cap | 12.41B |
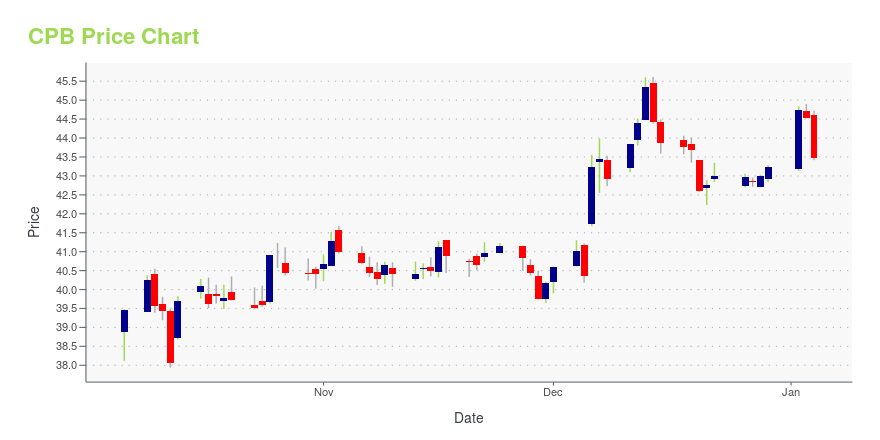
CPB Stock Price Chart Interactive Chart >
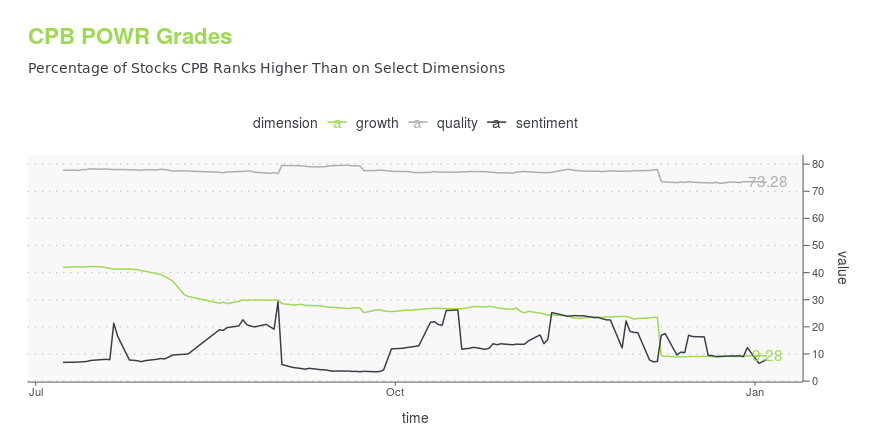
CPB POWR Grades
- Quality is the dimension where CPB ranks best; there it ranks ahead of 73.28% of US stocks.
- The strongest trend for CPB is in Growth, which has been heading down over the past 26 weeks.
- CPB ranks lowest in Sentiment; there it ranks in the 7th percentile.
CPB Stock Summary
- CAMPBELL SOUP CO's market capitalization of $13,274,385,653 is ahead of 85.82% of US-listed equities.
- With a one year PEG ratio of 1,573.4, CAMPBELL SOUP CO is expected to have a higher PEG ratio (a measure of how expensive a stock is relative to its expected earnings growth) than 97.88% of US stocks.
- CAMPBELL SOUP CO's stock had its IPO on January 1, 1986, making it an older stock than 92.92% of US equities in our set.
- If you're looking for stocks that are quantitatively similar to CAMPBELL SOUP CO, a group of peers worth examining would be KAI, BCPC, UTMD, CLIR, and FND.
- Visit CPB's SEC page to see the company's official filings. To visit the company's web site, go to www.campbellsoupcompany.com.
CPB Valuation Summary
- In comparison to the median Consumer Defensive stock, CPB's EV/EBIT ratio is 19.2% lower, now standing at 14.1.
- Over the past 243 months, CPB's EV/EBIT ratio has gone up 1.1.

Below are key valuation metrics over time for CPB.
| Stock | Date | P/S | P/B | P/E | EV/EBIT |
|---|---|---|---|---|---|
| CPB | 2023-12-22 | 1.4 | 3.4 | 16.1 | 14.1 |
| CPB | 2023-12-21 | 1.4 | 3.4 | 16.0 | 14.0 |
| CPB | 2023-12-20 | 1.4 | 3.4 | 16.0 | 14.0 |
| CPB | 2023-12-19 | 1.4 | 3.5 | 16.4 | 14.2 |
| CPB | 2023-12-18 | 1.4 | 3.5 | 16.4 | 14.3 |
| CPB | 2023-12-15 | 1.4 | 3.5 | 16.5 | 14.3 |
CPB Growth Metrics
- The 4 year net cashflow from operations growth rate now stands at 6.51%.
- The 3 year net cashflow from operations growth rate now stands at -12.18%.
- Its 4 year price growth rate is now at -13.84%.

The table below shows CPB's growth in key financial areas (numbers in millions of US dollars).
| Date | Revenue | Operating Cash Flow | Net Income to Common Stock |
|---|---|---|---|
| 2022-09-30 | 8,901 | 1,120 | 793 |
| 2022-06-30 | 8,562 | 1,181 | 757 |
| 2022-03-31 | 8,448 | 1,255 | 949 |
| 2021-12-31 | 8,302 | 1,190 | 921 |
| 2021-09-30 | 8,372 | 1,143 | 954 |
| 2021-06-30 | 8,476 | 1,035 | 1,002 |
CPB's Quality Factors
The “Quality” component of the POWR Ratings focuses on 31 different factors of a companies fundamentals and operational strength. Here are some key insights as we drill into the specifics of these quality attributes.- CPB has a Quality Grade of B, ranking ahead of 78.87% of graded US stocks.
- CPB's asset turnover comes in at 0.701 -- ranking 35th of 58 Food Products stocks.
- GIS, CAG, and FTFT are the stocks whose asset turnover ratios are most correlated with CPB.

The table below shows CPB's key quality metrics over time.
| Period | Asset Turnover | Gross Margin | ROIC |
|---|---|---|---|
| 2021-08-01 | 0.701 | 0.332 | 0.204 |
| 2021-05-02 | 0.711 | 0.341 | 0.174 |
| 2021-01-31 | 0.717 | 0.347 | 0.175 |
| 2020-11-01 | 0.720 | 0.347 | 0.307 |
| 2020-08-02 | 0.697 | 0.345 | 0.261 |
| 2020-04-26 | 0.597 | 0.343 | 0.221 |
CPB Price Target
For more insight on analysts targets of CPB, see our CPB price target page. And for a list of of all stocks sorted by upside potential based on analyst target price, see our Top Price Target page.
| Average Price Target | $46.51 | Average Broker Recommendation | 2.06 (Hold) |
Campbell Soup Co. (CPB) Company Bio
Campbell Soup Company, doing business as Campbell's, is an American processed food and snack company. The company is most closely associated with its flagship canned soup products; however, through mergers and acquisitions, it has grown to become one of the largest processed food companies in the U.S. with a wide variety of products under its flagship Campbell's brand as well as other brands like Pepperidge Farm, Snyder's of Hanover, V8, and Swanson. Under its brands, Campbell's produces soups and other canned meals, baked goods, beverages, and snacks. It is headquartered in Camden, New Jersey. (Source:Wikipedia)
Latest CPB News From Around the Web
Below are the latest news stories about CAMPBELL SOUP CO that investors may wish to consider to help them evaluate CPB as an investment opportunity.
How Food Stocks Spoiled in 2023Companies making packaged food were among the most notable U.S. stock underperformers of the year, and the causes were many. Next year might look better. |
Campbell Soup (CPB) Shows Strategic Resilience Amid ChallengesCampbell Soup's (CPB) focus on maintaining competitive pricing, sustaining marketing and innovation initiatives and adhering to a balanced spending approach bodes well amid industry woes. |
Campbell Soup (NYSE:CPB) Has Announced A Dividend Of $0.37The board of Campbell Soup Company ( NYSE:CPB ) has announced that it will pay a dividend of $0.37 per share on the... |
Why This 1 Momentum Stock Could Be a Great Addition to Your PortfolioWhether you're a value, growth, or momentum investor, finding strong stocks becomes easier with the Zacks Style Scores, a top feature of the Zacks Premium research service. |
Campaign Trail: Snyder’s pretzels save gingerbread people from houses made of themselvesThe effort includes a PSA-style spot for YouTube and social video that riffs on a macabre observation about a longstanding holiday tradition. |
CPB Price Returns
| 1-mo | -3.94% |
| 3-mo | 2.82% |
| 6-mo | 0.95% |
| 1-year | -18.22% |
| 3-year | -1.56% |
| 5-year | 37.87% |
| YTD | -3.32% |
| 2023 | -21.45% |
| 2022 | 34.84% |
| 2021 | -7.19% |
| 2020 | 0.72% |
| 2019 | 55.19% |
CPB Dividends
| Ex-Dividend Date | Type | Payout Amount | Change | ||||||
|---|---|---|---|---|---|---|---|---|---|
| Loading, please wait... | |||||||||
Continue Researching CPB
Here are a few links from around the web to help you further your research on Campbell Soup Co's stock as an investment opportunity:Campbell Soup Co (CPB) Stock Price | Nasdaq
Campbell Soup Co (CPB) Stock Quote, History and News - Yahoo Finance
Campbell Soup Co (CPB) Stock Price and Basic Information | MarketWatch
Loading social stream, please wait...