
Eli Lilly & Co. (LLY): Price and Financial Metrics
LLY Price/Volume Stats
| Current price | $782.06 | 52-week high | $794.47 |
| Prev. close | $757.78 | 52-week low | $309.20 |
| Day low | $763.50 | Volume | 5,009,300 |
| Day high | $794.47 | Avg. volume | 3,432,464 |
| 50-day MA | $636.18 | Dividend yield | 0.66% |
| 200-day MA | $546.36 | Market Cap | 742.42B |
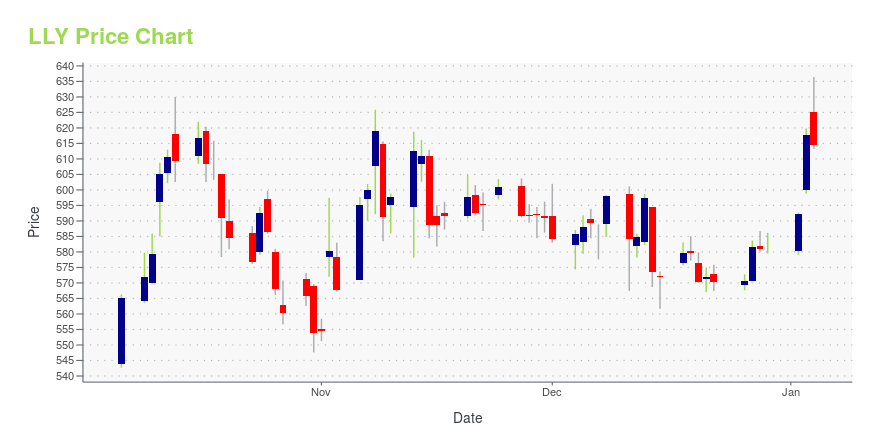
LLY Stock Price Chart Interactive Chart >
LLY POWR Grades
- Growth is the dimension where LLY ranks best; there it ranks ahead of 82.46% of US stocks.
- LLY's strongest trending metric is Quality; it's been moving down over the last 26 weeks.
- LLY's current lowest rank is in the Momentum metric (where it is better than 6.62% of US stocks).

LLY Stock Summary
- With a market capitalization of $586,387,080,295, ELI LILLY & CO has a greater market value than 99.8% of US stocks.
- LLY's current price/earnings ratio is 117.55, which is higher than 94.81% of US stocks with positive earnings.
- The price/operating cash flow metric for ELI LILLY & CO is higher than 96.97% of stocks in our set with a positive cash flow.
- Stocks that are quantitatively similar to LLY, based on their financial statements, market capitalization, and price volatility, are AVGO, TSM, TSLA, JNJ, and UNH.
- Visit LLY's SEC page to see the company's official filings. To visit the company's web site, go to www.lilly.com.
LLY Valuation Summary
- LLY's EV/EBIT ratio is 93; this is 536.99% higher than that of the median Healthcare stock.
- Over the past 243 months, LLY's price/sales ratio has gone up 10.8.

Below are key valuation metrics over time for LLY.
| Stock | Date | P/S | P/B | P/E | EV/EBIT |
|---|---|---|---|---|---|
| LLY | 2023-12-29 | 17.3 | 49.3 | 110.9 | 93.0 |
| LLY | 2023-12-28 | 17.2 | 49.1 | 110.5 | 92.7 |
| LLY | 2023-12-27 | 17.2 | 49.2 | 110.7 | 92.8 |
| LLY | 2023-12-26 | 16.9 | 48.3 | 108.6 | 91.1 |
| LLY | 2023-12-22 | 16.9 | 48.3 | 108.5 | 91.1 |
| LLY | 2023-12-21 | 16.9 | 48.4 | 108.9 | 91.3 |
LLY Growth Metrics
- The 5 year revenue growth rate now stands at 6.96%.
- The year over year net cashflow from operations growth rate now stands at 3.17%.
- Its 4 year price growth rate is now at 87.77%.
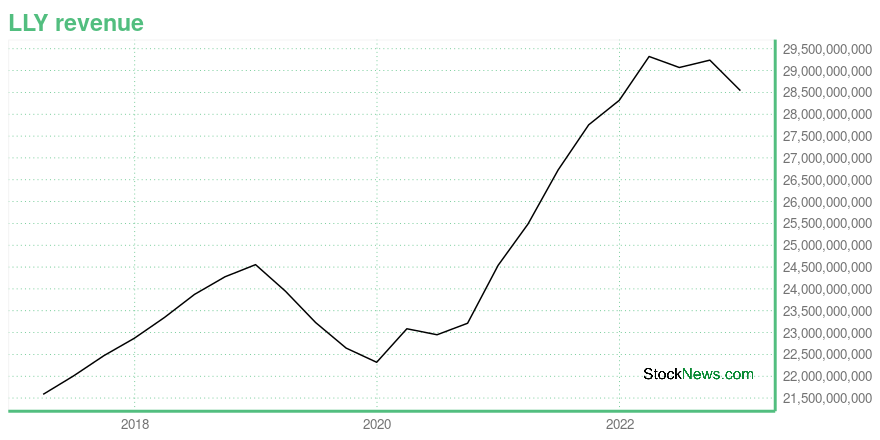
The table below shows LLY's growth in key financial areas (numbers in millions of US dollars).
| Date | Revenue | Operating Cash Flow | Net Income to Common Stock |
|---|---|---|---|
| 2022-12-31 | 28,541.4 | 7,084.4 | 6,244.8 |
| 2022-09-30 | 29,239.5 | 7,661.2 | 6,033.2 |
| 2022-06-30 | 29,070.7 | 7,107.7 | 5,691.6 |
| 2022-03-31 | 29,322.8 | 8,062.5 | 6,129.3 |
| 2021-12-31 | 28,318.4 | 7,260.7 | 5,581.7 |
| 2021-09-30 | 27,758.5 | 6,919.4 | 5,972.4 |
LLY's Quality Factors
The “Quality” component of the POWR Ratings focuses on 31 different factors of a companies fundamentals and operational strength. Here are some key insights as we drill into the specifics of these quality attributes.- LLY has a Quality Grade of B, ranking ahead of 90.11% of graded US stocks.
- LLY's asset turnover comes in at 0.586 -- ranking 60th of 681 Pharmaceutical Products stocks.
- BHC, VRTX, and DRRX are the stocks whose asset turnover ratios are most correlated with LLY.

The table below shows LLY's key quality metrics over time.
| Period | Asset Turnover | Gross Margin | ROIC |
|---|---|---|---|
| 2021-09-30 | 0.586 | 0.748 | 0.191 |
| 2021-06-30 | 0.577 | 0.743 | 0.199 |
| 2021-03-31 | 0.568 | 0.759 | 0.203 |
| 2020-12-31 | 0.565 | 0.777 | 0.214 |
| 2020-09-30 | 0.558 | 0.783 | 0.198 |
| 2020-06-30 | 0.573 | 0.787 | 0.202 |
LLY Price Target
For more insight on analysts targets of LLY, see our LLY price target page. And for a list of of all stocks sorted by upside potential based on analyst target price, see our Top Price Target page.
| Average Price Target | $265.88 | Average Broker Recommendation | 1.5 (Moderate Buy) |
Eli Lilly & Co. (LLY) Company Bio
Eli Lilly and Company is an American pharmaceutical company headquartered in Indianapolis, Indiana, with offices in 18 countries. Its products are sold in approximately 125 countries. The company was founded in 1876 by, and named after, Col. Eli Lilly, a pharmaceutical chemist and veteran of the American Civil War. (Source:Wikipedia)
Latest LLY News From Around the Web
Below are the latest news stories about ELI LILLY & CO that investors may wish to consider to help them evaluate LLY as an investment opportunity.
2024’s Power Players: 7 Stocks Racing to a Trillion ValuationWhether in 2024, or in the years ahead, each of these seven stocks could become the next trillion dollar companies. |
3 Ken Griffin Stocks to Invest Like CitadelInvest like Citadel founder and billionaire Ken Griffin with these stocks that have strong potential heading into 2024. |
Top 3 Large-Cap Growth Stock Picks for the New YearCrisis is creating opportunity for investors with some of these large-cap growth stocks for New Year 2024. |
Why Fusion Pharmaceuticals (FUSN) Stock Was Up 14% on WednesdayFusion Pharmaceuticals (FUSN) surges to a new record level 52-week high after analysts at Raymond James upgraded its rating following the buyout announcements for two comparable companies. |
New weight loss drugs are out of reach for millions of older Americans because Medicare won't payNew obesity drugs are showing promising results in helping some people shed pounds but the injections will remain out of reach for millions of older Americans because Medicare is forbidden to cover such medications. As obesity rates rise among older adults, some lawmakers say the United States cannot afford to keep a decades-old law that prohibits Medicare from paying for new weight loss drugs, including Wegovy and Zepbound. A look at the debate around if — and how — Medicare should cover obesity drugs: WHAT OBESITY DRUGS ARE ON THE MARKET AND HOW DO THEY WORK? |
LLY Price Returns
| 1-mo | 24.64% |
| 3-mo | 32.20% |
| 6-mo | 41.84% |
| 1-year | 140.14% |
| 3-year | 303.51% |
| 5-year | 588.59% |
| YTD | 34.40% |
| 2023 | 60.91% |
| 2022 | 34.26% |
| 2021 | 66.08% |
| 2020 | 31.04% |
| 2019 | 16.14% |
LLY Dividends
| Ex-Dividend Date | Type | Payout Amount | Change | ||||||
|---|---|---|---|---|---|---|---|---|---|
| Loading, please wait... | |||||||||
Continue Researching LLY
Want to see what other sources are saying about ELI LILLY & Co's financials and stock price? Try the links below:ELI LILLY & Co (LLY) Stock Price | Nasdaq
ELI LILLY & Co (LLY) Stock Quote, History and News - Yahoo Finance
ELI LILLY & Co (LLY) Stock Price and Basic Information | MarketWatch
Loading social stream, please wait...