
Southern Copper Corp. (SCCO): Price and Financial Metrics
SCCO Price/Volume Stats
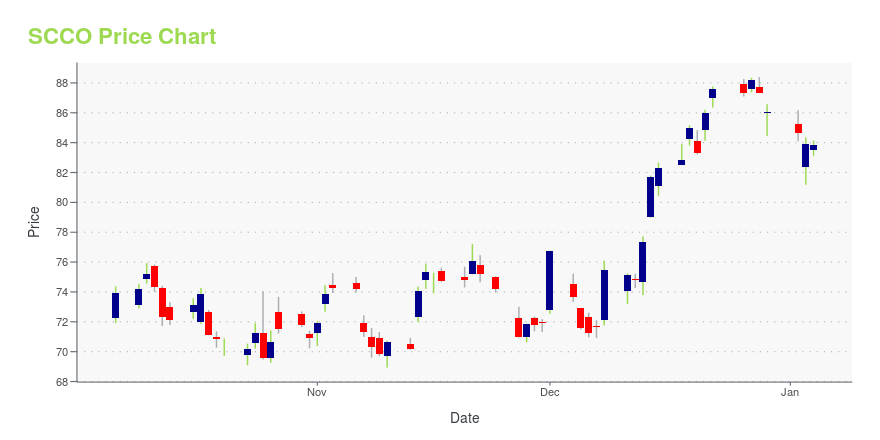
| Current price | $83.69 | 52-week high | $88.40 |
| Prev. close | $82.97 | 52-week low | $64.66 |
| Day low | $83.50 | Volume | 900,100 |
| Day high | $85.62 | Avg. volume | 938,885 |
| 50-day MA | $81.87 | Dividend yield | 3.82% |
| 200-day MA | $76.68 | Market Cap | 64.70B |
SCCO Stock Price Chart Interactive Chart >
SCCO POWR Grades
- Quality is the dimension where SCCO ranks best; there it ranks ahead of 97.96% of US stocks.
- SCCO's strongest trending metric is Growth; it's been moving down over the last 26 weeks.
- SCCO's current lowest rank is in the Momentum metric (where it is better than 22.45% of US stocks).

SCCO Stock Summary
- With a market capitalization of $64,856,237,244, SOUTHERN COPPER CORP has a greater market value than 96.15% of US stocks.
- SCCO's one year PEG ratio, measuring expected growth in earnings next year relative to current common stock price is 531.16 -- higher than 94.13% of US-listed equities with positive expected earnings growth.
- Of note is the ratio of SOUTHERN COPPER CORP's sales and general administrative expense to its total operating expenses; only 4.34% of US stocks have a lower such ratio.
- Stocks with similar financial metrics, market capitalization, and price volatility to SOUTHERN COPPER CORP are EOG, PSA, PXD, O, and ET.
- Visit SCCO's SEC page to see the company's official filings. To visit the company's web site, go to www.southerncoppercorp.com.
SCCO Valuation Summary
- In comparison to the median Basic Materials stock, SCCO's price/earnings ratio is 38.32% higher, now standing at 23.1.
- Over the past 243 months, SCCO's price/sales ratio has gone up 1.

Below are key valuation metrics over time for SCCO.
| Stock | Date | P/S | P/B | P/E | EV/EBIT |
|---|---|---|---|---|---|
| SCCO | 2023-12-29 | 6.4 | 8.6 | 23.1 | 14.6 |
| SCCO | 2023-12-28 | 6.5 | 8.7 | 23.4 | 14.8 |
| SCCO | 2023-12-27 | 6.5 | 8.8 | 23.7 | 15.0 |
| SCCO | 2023-12-26 | 6.5 | 8.7 | 23.4 | 14.8 |
| SCCO | 2023-12-22 | 6.5 | 8.7 | 23.5 | 14.9 |
| SCCO | 2023-12-21 | 6.4 | 8.6 | 23.1 | 14.6 |
SCCO Growth Metrics
- The 3 year net income to common stockholders growth rate now stands at 134.04%.
- The year over year cash and equivalents growth rate now stands at 25.58%.
- Its year over year net income to common stockholders growth rate is now at 61.27%.
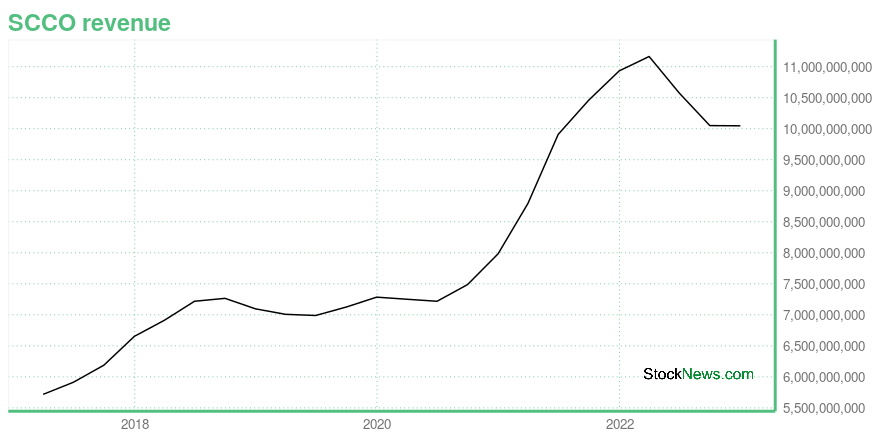
The table below shows SCCO's growth in key financial areas (numbers in millions of US dollars).
| Date | Revenue | Operating Cash Flow | Net Income to Common Stock |
|---|---|---|---|
| 2022-12-31 | 10,047.9 | 2,802.5 | 2,638.5 |
| 2022-09-30 | 10,051.3 | 2,948.4 | 2,568.9 |
| 2022-06-30 | 10,575.3 | 3,578.9 | 2,917.5 |
| 2022-03-31 | 11,165.4 | 4,330.5 | 3,417.9 |
| 2021-12-31 | 10,934.1 | 4,292.4 | 3,397.1 |
| 2021-09-30 | 10,461.1 | 4,160.3 | 3,154.2 |
SCCO's Quality Factors
The “Quality” component of the POWR Ratings focuses on 31 different factors of a companies fundamentals and operational strength. Here are some key insights as we drill into the specifics of these quality attributes.- SCCO has a Quality Grade of B, ranking ahead of 94.88% of graded US stocks.
- SCCO's asset turnover comes in at 0.598 -- ranking 8th of 42 Non-Metallic and Industrial Metal Mining stocks.
- TRQ, HL, and SND are the stocks whose asset turnover ratios are most correlated with SCCO.

The table below shows SCCO's key quality metrics over time.
| Period | Asset Turnover | Gross Margin | ROIC |
|---|---|---|---|
| 2021-09-30 | 0.598 | 0.627 | 0.268 |
| 2021-06-30 | 0.582 | 0.604 | 0.243 |
| 2021-03-31 | 0.531 | 0.555 | 0.192 |
| 2020-12-31 | 0.490 | 0.508 | 0.153 |
| 2020-09-30 | 0.463 | 0.483 | 0.130 |
| 2020-06-30 | 0.445 | 0.470 | 0.119 |
Southern Copper Corp. (SCCO) Company Bio
Southern Copper Corporation is a mining company that was founded in 1952. The current incarnation of Southern Copper can be traced to the 2005 acquisition of Southern Peru Copper Corporation by the Mexican copper producer Minera México. (Source:Wikipedia)
Latest SCCO News From Around the Web
Below are the latest news stories about SOUTHERN COPPER CORP that investors may wish to consider to help them evaluate SCCO as an investment opportunity.
Quiet Income Kings: 3 Under-the-Radar Dividend Stocks to Buy NowDiscover under-the-radar dividend stocks with our in-depth analysis. |
15 Biggest Silver Mining Companies in the WorldThis article will list the world’s top silver mining companies and highlight the recent trends in the silver industry. You can skip our detailed overview of supply and demand intricacies of silver and read 5 Biggest Silver Mining Companies in the World. Global Silver Demand and Supply In 2022, the dynamics of global silver demand and […] |
High Return Hunt: 7 Dividend Stocks Offering Undiscovered ValueThese are the undervalued dividend stocks to buy as they represent fundamentally strong stories that can create value. |
15 Best Materials Stocks To Invest InIn this article, we will take a look at the 15 best materials stocks to invest in. To see more such companies, go directly to 5 Best Materials Stocks to Invest In. The year 2024 is poised to reveal the enduring consequences of substantial government expenditures and tax incentives aimed at bolstering manufacturing and infrastructure, […] |
Southern Copper Is More Likely to Head North Than SouthSouthern Copper Corp. was cut to an underweight (sell) rating at Morgan Stanley here on Monday with a $68 price target. Let's check out the charts and indicators of Southern Copper, which I last reviewed on July 26, to see if the analyst looked at the technical setup of the copper miner. In this daily bar chart of SCCO, below, I can see a slight upward progression over the past 12 months. |
SCCO Price Returns
| 1-mo | 4.25% |
| 3-mo | 11.13% |
| 6-mo | 5.24% |
| 1-year | 18.62% |
| 3-year | 24.19% |
| 5-year | 197.50% |
| YTD | -1.78% |
| 2023 | 50.12% |
| 2022 | 4.25% |
| 2021 | -0.62% |
| 2020 | 58.79% |
| 2019 | 44.61% |
SCCO Dividends
| Ex-Dividend Date | Type | Payout Amount | Change | ||||||
|---|---|---|---|---|---|---|---|---|---|
| Loading, please wait... | |||||||||
Continue Researching SCCO
Want to do more research on Southern Copper Corp's stock and its price? Try the links below:Southern Copper Corp (SCCO) Stock Price | Nasdaq
Southern Copper Corp (SCCO) Stock Quote, History and News - Yahoo Finance
Southern Copper Corp (SCCO) Stock Price and Basic Information | MarketWatch
Loading social stream, please wait...