
Public Service Enterprise Group Inc. (PEG): Price and Financial Metrics
PEG Price/Volume Stats
| Current price | $59.79 | 52-week high | $65.46 |
| Prev. close | $59.60 | 52-week low | $53.71 |
| Day low | $59.02 | Volume | 2,411,500 |
| Day high | $60.10 | Avg. volume | 2,620,288 |
| 50-day MA | $60.18 | Dividend yield | 3.81% |
| 200-day MA | $61.20 | Market Cap | 29.79B |
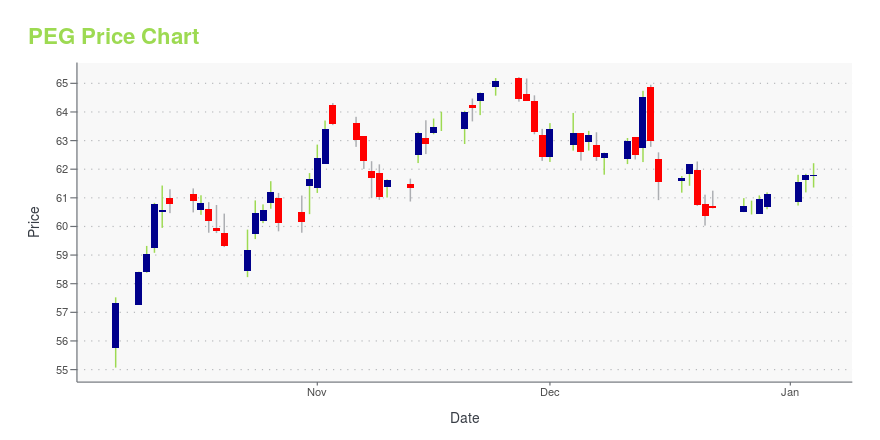
PEG Stock Price Chart Interactive Chart >
PEG POWR Grades
- Quality is the dimension where PEG ranks best; there it ranks ahead of 51.5% of US stocks.
- PEG's strongest trending metric is Quality; it's been moving down over the last 26 weeks.
- PEG ranks lowest in Growth; there it ranks in the 1st percentile.

PEG Stock Summary
- Of note is the ratio of PUBLIC SERVICE ENTERPRISE GROUP INC's sales and general administrative expense to its total operating expenses; only 0.17% of US stocks have a lower such ratio.
- The ratio of debt to operating expenses for PUBLIC SERVICE ENTERPRISE GROUP INC is higher than it is for about 96.28% of US stocks.
- In terms of volatility of its share price, PEG is more volatile than merely 0.55% of stocks we're observing.
- If you're looking for stocks that are quantitatively similar to PUBLIC SERVICE ENTERPRISE GROUP INC, a group of peers worth examining would be XEL, AWK, WEC, ETR, and ES.
- Visit PEG's SEC page to see the company's official filings. To visit the company's web site, go to www.pseg.com.
PEG Valuation Summary
- PEG's EV/EBIT ratio is 12.1; this is 37.79% lower than that of the median Utilities stock.
- PEG's EV/EBIT ratio has moved up 2.4 over the prior 243 months.

Below are key valuation metrics over time for PEG.
| Stock | Date | P/S | P/B | P/E | EV/EBIT |
|---|---|---|---|---|---|
| PEG | 2023-12-27 | 2.6 | 2 | 10.8 | 12.1 |
| PEG | 2023-12-26 | 2.6 | 2 | 10.8 | 12.1 |
| PEG | 2023-12-22 | 2.6 | 2 | 10.8 | 12.1 |
| PEG | 2023-12-21 | 2.6 | 2 | 10.7 | 12.1 |
| PEG | 2023-12-20 | 2.6 | 2 | 10.8 | 12.1 |
| PEG | 2023-12-19 | 2.6 | 2 | 11.0 | 12.3 |
PEG Growth Metrics
- The 4 year revenue growth rate now stands at 9.3%.
- Its 3 year net cashflow from operations growth rate is now at -60.51%.
- Its year over year cash and equivalents growth rate is now at 99.63%.

The table below shows PEG's growth in key financial areas (numbers in millions of US dollars).
| Date | Revenue | Operating Cash Flow | Net Income to Common Stock |
|---|---|---|---|
| 2022-12-31 | 9,800 | 1,503 | 1,031 |
| 2022-09-30 | 9,717 | 1,259 | 688 |
| 2022-06-30 | 9,348 | 1,043 | -990 |
| 2022-03-31 | 9,146 | 1,181 | -1,298 |
| 2021-12-31 | 9,722 | 1,736 | -648 |
| 2021-09-30 | 9,068 | 1,763 | -662 |
PEG's Quality Factors
The “Quality” component of the POWR Ratings focuses on 31 different factors of a companies fundamentals and operational strength. Here are some key insights as we drill into the specifics of these quality attributes.- PEG has a Quality Grade of C, ranking ahead of 33.8% of graded US stocks.
- PEG's asset turnover comes in at 0.182 -- ranking 71st of 105 Utilities stocks.
- AWR, OGS, and NEE are the stocks whose asset turnover ratios are most correlated with PEG.

The table below shows PEG's key quality metrics over time.
| Period | Asset Turnover | Gross Margin | ROIC |
|---|---|---|---|
| 2021-09-30 | 0.182 | 0.283 | -0.010 |
| 2021-06-30 | 0.192 | 0.331 | 0.038 |
| 2021-03-31 | 0.196 | 0.349 | 0.052 |
| 2020-12-31 | 0.195 | 0.357 | 0.048 |
| 2020-09-30 | 0.199 | 0.361 | 0.048 |
| 2020-06-30 | 0.201 | 0.361 | 0.044 |
PEG Price Target
For more insight on analysts targets of PEG, see our PEG price target page. And for a list of of all stocks sorted by upside potential based on analyst target price, see our Top Price Target page.
| Average Price Target | $68.95 | Average Broker Recommendation | 1.55 (Moderate Buy) |
Public Service Enterprise Group Inc. (PEG) Company Bio
The Public Service Enterprise Group (PSEG) is a publicly traded diversified energy company headquartered in Newark, New Jersey and was established in 1985 with a legacy dating back to 1903. (Source:Wikipedia)
Latest PEG News From Around the Web
Below are the latest news stories about PUBLIC SERVICE ENTERPRISE GROUP INC that investors may wish to consider to help them evaluate PEG as an investment opportunity.
15 Undervalued Defensive Stocks For 2024In this article, we discuss the 15 undervalued defensive stocks for 2024. To skip the detailed overview of the market and defensive stocks, go directly to the 5 Undervalued Defensive Stocks For 2024. Defensive stocks are shares of companies that remain relatively stable during economic downturns as opposed to cyclical stocks. Defensive stocks usually outperform […] |
Boasting A 18% Return On Equity, Is Public Service Enterprise Group Incorporated (NYSE:PEG) A Top Quality Stock?Many investors are still learning about the various metrics that can be useful when analysing a stock. This article is... |
Institutional shareholders may be less affected by Public Service Enterprise Group Incorporated's (NYSE:PEG) pullback last week after a year of 6.7% returnsKey Insights Significantly high institutional ownership implies Public Service Enterprise Group's stock price is... |
7 ‘Bulletproof’ Stocks to Buy Ahead of a Wild New YearAlthough a new year tends to bring optimism in the market, current vagaries warrant a discussion about bulletproof stocks to buy for 2024. |
PSEG Initiates 2024 Non-GAAP Operating Earnings GuidancePublic Service Enterprise Group (NYSE: PEG) has initiated 2024 non-GAAP Operating Earnings guidance in the range of $3.60 to $3.70 per share. The midpoint of the Company's 2024 guidance represents earnings growth of approximately 6% from the midpoint of its 2023 non-GAAP Operating Earnings guidance of $3.40 to $3.50 per share. |
PEG Price Returns
| 1-mo | 2.12% |
| 3-mo | -5.93% |
| 6-mo | 0.28% |
| 1-year | -0.24% |
| 3-year | 14.88% |
| 5-year | 25.41% |
| YTD | -2.22% |
| 2023 | 3.62% |
| 2022 | -5.09% |
| 2021 | 18.34% |
| 2020 | 2.37% |
| 2019 | 17.09% |
PEG Dividends
| Ex-Dividend Date | Type | Payout Amount | Change | ||||||
|---|---|---|---|---|---|---|---|---|---|
| Loading, please wait... | |||||||||
Continue Researching PEG
Want to do more research on Public Service Enterprise Group Inc's stock and its price? Try the links below:Public Service Enterprise Group Inc (PEG) Stock Price | Nasdaq
Public Service Enterprise Group Inc (PEG) Stock Quote, History and News - Yahoo Finance
Public Service Enterprise Group Inc (PEG) Stock Price and Basic Information | MarketWatch
Loading social stream, please wait...