
Southern Co. (SO): Price and Financial Metrics
SO Price/Volume Stats
| Current price | $66.48 | 52-week high | $75.80 |
| Prev. close | $66.83 | 52-week low | $61.56 |
| Day low | $65.80 | Volume | 8,509,100 |
| Day high | $66.64 | Avg. volume | 4,785,009 |
| 50-day MA | $69.77 | Dividend yield | 4.21% |
| 200-day MA | $69.54 | Market Cap | 72.50B |
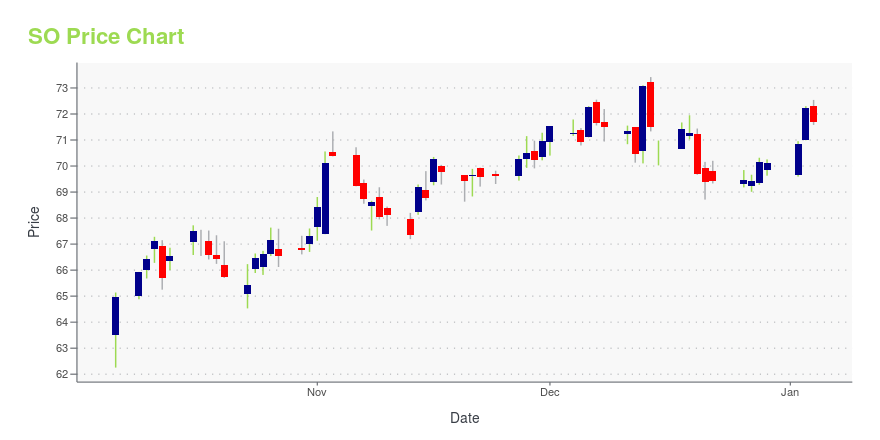
SO Stock Price Chart Interactive Chart >
SO POWR Grades
- SO scores best on the Stability dimension, with a Stability rank ahead of 67.77% of US stocks.
- SO's strongest trending metric is Growth; it's been moving up over the last 26 weeks.
- SO's current lowest rank is in the Value metric (where it is better than 6.99% of US stocks).

SO Stock Summary
- With a market capitalization of $78,786,341,772, SOUTHERN CO has a greater market value than 97% of US stocks.
- Of note is the ratio of SOUTHERN CO's sales and general administrative expense to its total operating expenses; only 0.17% of US stocks have a lower such ratio.
- In terms of volatility of its share price, SO is more volatile than merely 1.02% of stocks we're observing.
- Stocks that are quantitatively similar to SO, based on their financial statements, market capitalization, and price volatility, are CSX, DUK, PCG, D, and IBN.
- Visit SO's SEC page to see the company's official filings. To visit the company's web site, go to www.southerncompany.com.
SO Valuation Summary
- SO's price/sales ratio is 2.9; this is 61.11% higher than that of the median Utilities stock.
- Over the past 243 months, SO's EV/EBIT ratio has gone up 10.9.

Below are key valuation metrics over time for SO.
| Stock | Date | P/S | P/B | P/E | EV/EBIT |
|---|---|---|---|---|---|
| SO | 2023-12-27 | 2.9 | 2.1 | 24.9 | 23.5 |
| SO | 2023-12-26 | 2.9 | 2.1 | 25.0 | 23.5 |
| SO | 2023-12-22 | 2.9 | 2.1 | 25.0 | 23.5 |
| SO | 2023-12-21 | 2.9 | 2.1 | 24.9 | 23.5 |
| SO | 2023-12-20 | 2.9 | 2.2 | 25.0 | 23.5 |
| SO | 2023-12-19 | 3.0 | 2.2 | 25.6 | 23.8 |
SO Growth Metrics
- Its 4 year net cashflow from operations growth rate is now at 20.4%.
- Its 4 year price growth rate is now at 14.68%.
- The 5 year net income to common stockholders growth rate now stands at 34.4%.
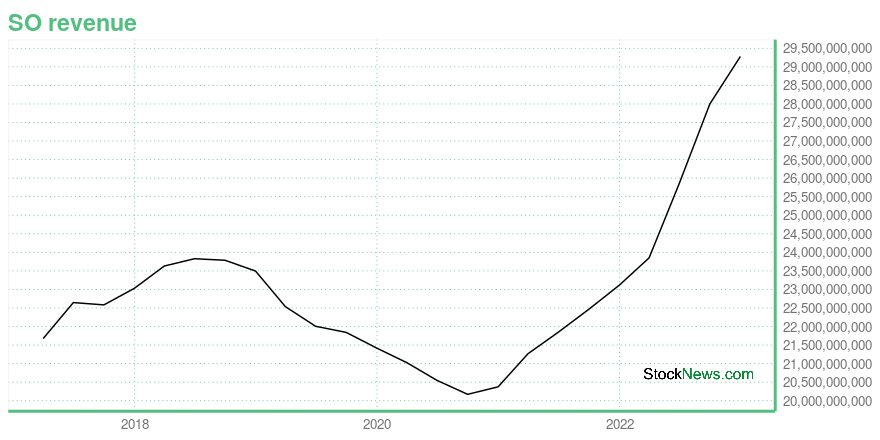
The table below shows SO's growth in key financial areas (numbers in millions of US dollars).
| Date | Revenue | Operating Cash Flow | Net Income to Common Stock |
|---|---|---|---|
| 2022-12-31 | 29,279 | 6,302 | 3,524 |
| 2022-09-30 | 27,999 | 6,105 | 3,396 |
| 2022-06-30 | 25,859 | 6,844 | 3,025 |
| 2022-03-31 | 23,851 | 6,519 | 2,290 |
| 2021-12-31 | 23,113 | 6,169 | 2,393 |
| 2021-09-30 | 22,463 | 6,557 | 2,995 |
SO's Quality Factors
The “Quality” component of the POWR Ratings focuses on 31 different factors of a companies fundamentals and operational strength. Here are some key insights as we drill into the specifics of these quality attributes.- SO has a Quality Grade of C, ranking ahead of 47.28% of graded US stocks.
- SO's asset turnover comes in at 0.176 -- ranking 73rd of 105 Utilities stocks.
- ATO, ED, and AEP are the stocks whose asset turnover ratios are most correlated with SO.

The table below shows SO's key quality metrics over time.
| Period | Asset Turnover | Gross Margin | ROIC |
|---|---|---|---|
| 2021-06-30 | 0.176 | 0.413 | 0.034 |
| 2021-03-31 | 0.173 | 0.426 | 0.036 |
| 2020-12-31 | 0.168 | 0.425 | 0.035 |
| 2020-09-30 | 0.168 | 0.413 | 0.035 |
| 2020-06-30 | 0.173 | 0.413 | 0.037 |
| 2020-03-31 | 0.179 | 0.404 | 0.040 |
SO Price Target
For more insight on analysts targets of SO, see our SO price target page. And for a list of of all stocks sorted by upside potential based on analyst target price, see our Top Price Target page.
| Average Price Target | $68.39 | Average Broker Recommendation | 1.78 (Moderate Buy) |
Southern Co. (SO) Company Bio
Southern Company is an American gas and electric utility holding company based in the southern United States. It is headquartered in Atlanta, Georgia, with executive offices also located in Birmingham, Alabama. The company is currently the second largest utility company in the U.S. in terms of customer base. Through its subsidiaries it serves 9 million gas and electric utility customers in 6 states. Southern Company's regulated regional electric utilities serve a 120,000-square-mile (310,000 km2) territory with 27,000 miles (43,000 km) of distribution lines. (Source:Wikipedia)
Latest SO News From Around the Web
Below are the latest news stories about SOUTHERN CO that investors may wish to consider to help them evaluate SO as an investment opportunity.
EPRI and Southern Company Announce Speakers for Electrification 2024NORTHAMPTON, MA / ACCESSWIRE / December 28, 2023 /Southern Company EPRI and Southern Company recently announced the plenary speakers for the Electrification International Conference & Exposition, scheduled for March 12-14, 2024, in Savannah, Ga. Kicking ... |
If You Like Dividends, You Should Love These 3 StocksThese companies offer above-average dividend yields that should rise in the future. |
Southern Co. (SO) Increases Yet Falls Behind Market: What Investors Need to KnowThe latest trading day saw Southern Co. (SO) settling at $69.44, representing a +0.1% change from its previous close. |
Southern Company Again Named as a Trendsetter by CPA-Zicklin IndexFor the second-consecutive year, Southern Company grades above 90 points in corporate political disclosure and accountability. Southern Company NORTHAMPTON, MA / ACCESSWIRE / December 22, 2023 / The 2023 CPA-Zicklin Index of Corporate Political Disclosure ... |
Where Will The Southern Company Be in 3 Years?Southern is on the cusp of an important business shift, which should lead to an important change in the dividend policy. |
SO Price Returns
| 1-mo | -2.56% |
| 3-mo | -3.54% |
| 6-mo | 0.46% |
| 1-year | 3.88% |
| 3-year | 26.39% |
| 5-year | 64.15% |
| YTD | -4.19% |
| 2023 | 2.21% |
| 2022 | 8.24% |
| 2021 | 16.34% |
| 2020 | 0.63% |
| 2019 | 51.65% |
SO Dividends
| Ex-Dividend Date | Type | Payout Amount | Change | ||||||
|---|---|---|---|---|---|---|---|---|---|
| Loading, please wait... | |||||||||
Continue Researching SO
Want to see what other sources are saying about Southern Co's financials and stock price? Try the links below:Southern Co (SO) Stock Price | Nasdaq
Southern Co (SO) Stock Quote, History and News - Yahoo Finance
Southern Co (SO) Stock Price and Basic Information | MarketWatch
Loading social stream, please wait...