
Yelp Inc. (YELP): Price and Financial Metrics
YELP Price/Volume Stats
| Current price | $38.02 | 52-week high | $48.99 |
| Prev. close | $44.39 | 52-week low | $26.53 |
| Day low | $37.50 | Volume | 2,967,000 |
| Day high | $40.33 | Avg. volume | 708,903 |
| 50-day MA | $44.98 | Dividend yield | N/A |
| 200-day MA | $41.34 | Market Cap | 2.60B |
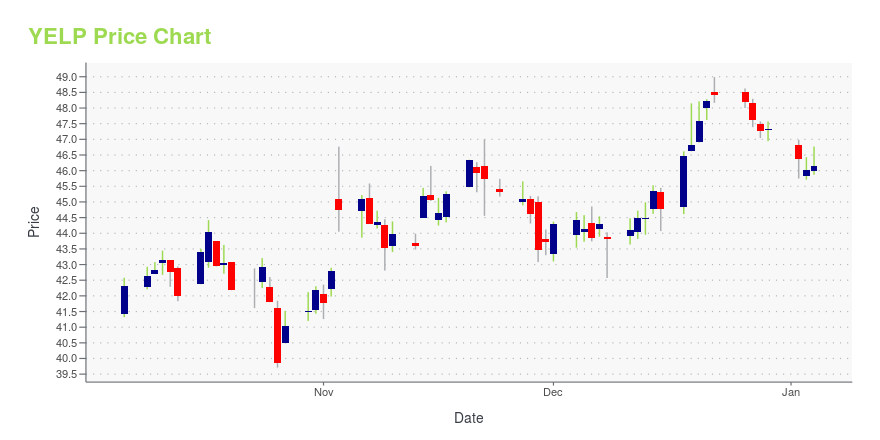
YELP Stock Price Chart Interactive Chart >
YELP POWR Grades
- Quality is the dimension where YELP ranks best; there it ranks ahead of 99.86% of US stocks.
- YELP's strongest trending metric is Stability; it's been moving up over the last 26 weeks.
- YELP's current lowest rank is in the Sentiment metric (where it is better than 42.23% of US stocks).

YELP Stock Summary
- The ratio of debt to operating expenses for YELP INC is higher than it is for about just 13.56% of US stocks.
- With a year-over-year growth in debt of -28.86%, YELP INC's debt growth rate surpasses merely 11.12% of about US stocks.
- In terms of twelve month growth in earnings before interest and taxes, YELP INC is reporting a growth rate of 115.73%; that's higher than 90.76% of US stocks.
- Stocks with similar financial metrics, market capitalization, and price volatility to YELP INC are DOCS, NTCT, FFIV, DGII, and SLGC.
- YELP's SEC filings can be seen here. And to visit YELP INC's official web site, go to www.yelp.com.
YELP Valuation Summary
- YELP's price/sales ratio is 2.5; this is 78.57% higher than that of the median Communication Services stock.
- Over the past 144 months, YELP's price/sales ratio has gone down 15.2.

Below are key valuation metrics over time for YELP.
| Stock | Date | P/S | P/B | P/E | EV/EBIT |
|---|---|---|---|---|---|
| YELP | 2023-12-29 | 2.5 | 4.4 | 35.3 | 28.0 |
| YELP | 2023-12-28 | 2.5 | 4.4 | 35.2 | 28.0 |
| YELP | 2023-12-27 | 2.5 | 4.4 | 35.5 | 28.2 |
| YELP | 2023-12-26 | 2.5 | 4.5 | 35.9 | 28.6 |
| YELP | 2023-12-22 | 2.5 | 4.5 | 36.1 | 28.7 |
| YELP | 2023-12-21 | 2.5 | 4.5 | 35.9 | 28.6 |
YELP Growth Metrics
- Its year over year cash and equivalents growth rate is now at -20.94%.
- Its 3 year cash and equivalents growth rate is now at 46.76%.
- Its year over year net income to common stockholders growth rate is now at 558.5%.
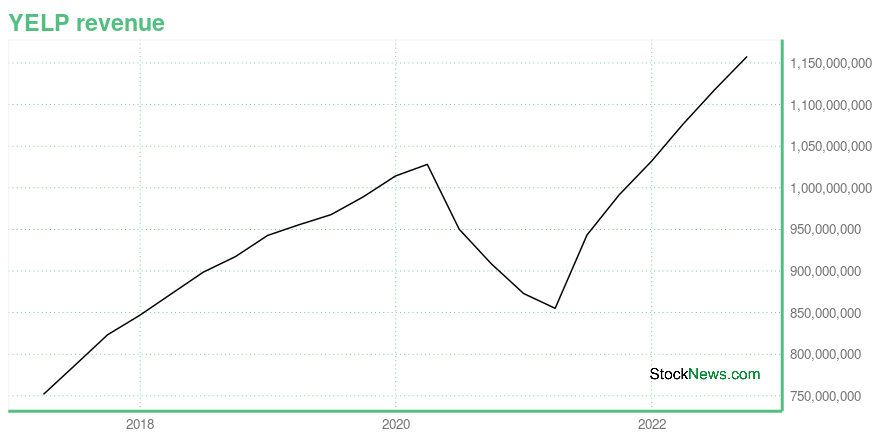
The table below shows YELP's growth in key financial areas (numbers in millions of US dollars).
| Date | Revenue | Operating Cash Flow | Net Income to Common Stock |
|---|---|---|---|
| 2022-09-30 | 1,157.803 | 192.756 | 39.392 |
| 2022-06-30 | 1,118.067 | 181.78 | 48.349 |
| 2022-03-31 | 1,076.371 | 213.627 | 44.552 |
| 2021-12-31 | 1,031.839 | 212.655 | 39.671 |
| 2021-09-30 | 991.634 | 216.051 | 37.57 |
| 2021-06-30 | 943.286 | 228.559 | 18.485 |
YELP's Quality Factors
The “Quality” component of the POWR Ratings focuses on 31 different factors of a companies fundamentals and operational strength. Here are some key insights as we drill into the specifics of these quality attributes.- YELP has a Quality Grade of A, ranking ahead of 98.86% of graded US stocks.
- YELP's asset turnover comes in at 0.832 -- ranking 18th of 50 Personal Services stocks.
- UHAL, CRAI, and R are the stocks whose asset turnover ratios are most correlated with YELP.

The table below shows YELP's key quality metrics over time.
| Period | Asset Turnover | Gross Margin | ROIC |
|---|---|---|---|
| 2021-06-30 | 0.832 | 0.935 | 0.034 |
| 2021-03-31 | 0.760 | 0.935 | -0.037 |
| 2020-12-31 | 0.784 | 0.934 | -0.064 |
| 2020-09-30 | 0.832 | 0.936 | -0.047 |
| 2020-06-30 | 0.893 | 0.935 | -0.036 |
| 2020-03-31 | 0.964 | 0.937 | 0.029 |
Yelp Inc. (YELP) Company Bio
Yelp Inc. operates a website covering various local business categories, including restaurants, shopping, beauty and fitness, arts, entertainment and events, home and local services, health, nightlife, travel and hotel, auto, and others categories. The company was founded in 2004 and is based in San Francisco, California.
Latest YELP News From Around the Web
Below are the latest news stories about YELP INC that investors may wish to consider to help them evaluate YELP as an investment opportunity.
Are Investors Undervaluing Yelp Inc. (NYSE:YELP) By 47%?Key Insights Using the 2 Stage Free Cash Flow to Equity, Yelp fair value estimate is US$89.50 Yelp is estimated to be... |
7 Unusual Options Activity Stocks That You Need to Pay Attention ToOne of the beautiful aspects of the derivatives market is that you don’t need to trade options to benefit from the underlying data; case in point is unusual options activity. |
New Yelp Has Earned Its Extra StarsThe online review pioneer has made its advertising business more cost effective, helping the stock make its best run in years. |
Insider Sell: Yelp Inc's COO Joseph Nachman Offloads 6,000 SharesIn a notable insider transaction, Joseph Nachman, the Chief Operating Officer (COO) of Yelp Inc (YELP), sold 6,000 shares of the company on November 27, 2023. |
Yelp to Participate in the Barclays Global Technology ConferenceSAN FRANCISCO, November 29, 2023--Yelp Inc. (NYSE: YELP), the company that connects people with great local businesses, today announced that management will present at the Barclays Global Technology Conference on Wednesday, December 6, 2023 at 12:45 p.m. Pacific Time. |
YELP Price Returns
| 1-mo | -13.59% |
| 3-mo | -17.19% |
| 6-mo | -10.79% |
| 1-year | 23.48% |
| 3-year | 5.17% |
| 5-year | -1.88% |
| YTD | -19.69% |
| 2023 | 73.15% |
| 2022 | -24.56% |
| 2021 | 10.93% |
| 2020 | -6.20% |
| 2019 | -0.46% |
Continue Researching YELP
Want to see what other sources are saying about Yelp Inc's financials and stock price? Try the links below:Yelp Inc (YELP) Stock Price | Nasdaq
Yelp Inc (YELP) Stock Quote, History and News - Yahoo Finance
Yelp Inc (YELP) Stock Price and Basic Information | MarketWatch
Loading social stream, please wait...