
Village Super Market, Inc. - (VLGEA): Price and Financial Metrics
VLGEA Price/Volume Stats
| Current price | $25.91 | 52-week high | $26.99 |
| Prev. close | $26.02 | 52-week low | $20.25 |
| Day low | $25.89 | Volume | 15,300 |
| Day high | $26.12 | Avg. volume | 23,112 |
| 50-day MA | $25.56 | Dividend yield | 3.86% |
| 200-day MA | $23.67 | Market Cap | 383.68M |
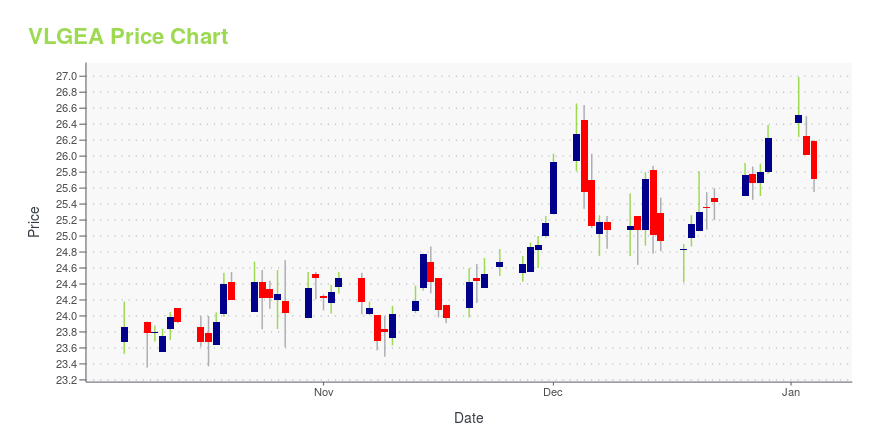
VLGEA Stock Price Chart Interactive Chart >
VLGEA POWR Grades
- Value is the dimension where VLGEA ranks best; there it ranks ahead of 98.12% of US stocks.
- The strongest trend for VLGEA is in Growth, which has been heading down over the past 26 weeks.
- VLGEA ranks lowest in Momentum; there it ranks in the 28th percentile.

VLGEA Stock Summary
- VILLAGE SUPER MARKET INC's capital turnover -- a measure of revenue relative to shareholder's equity -- is better than 91.19% of US listed stocks.
- VLGEA's price/sales ratio is 0.18; that's higher than the P/S ratio of merely 4.81% of US stocks.
- The volatility of VILLAGE SUPER MARKET INC's share price is greater than that of merely 10.35% US stocks with at least 200 days of trading history.
- Stocks with similar financial metrics, market capitalization, and price volatility to VILLAGE SUPER MARKET INC are ZEUS, ELA, RUSHA, ABG, and WYY.
- VLGEA's SEC filings can be seen here. And to visit VILLAGE SUPER MARKET INC's official web site, go to myvillagesupermarket.com.
VLGEA Valuation Summary
- In comparison to the median Consumer Defensive stock, VLGEA's price/earnings ratio is 64.11% lower, now standing at 7.5.
- VLGEA's price/sales ratio has moved up 0.1 over the prior 243 months.

Below are key valuation metrics over time for VLGEA.
| Stock | Date | P/S | P/B | P/E | EV/EBIT |
|---|---|---|---|---|---|
| VLGEA | 2023-12-22 | 0.2 | 0.9 | 7.5 | 8.1 |
| VLGEA | 2023-12-21 | 0.2 | 0.9 | 7.5 | 8.1 |
| VLGEA | 2023-12-20 | 0.2 | 0.9 | 7.5 | 8.0 |
| VLGEA | 2023-12-19 | 0.2 | 0.9 | 7.4 | 8.0 |
| VLGEA | 2023-12-18 | 0.2 | 0.9 | 7.3 | 8.0 |
| VLGEA | 2023-12-15 | 0.2 | 0.9 | 7.4 | 8.0 |
VLGEA Growth Metrics
- Its 4 year cash and equivalents growth rate is now at 11.23%.
- Its 2 year revenue growth rate is now at 20.24%.
- Its 2 year net income to common stockholders growth rate is now at 5.69%.
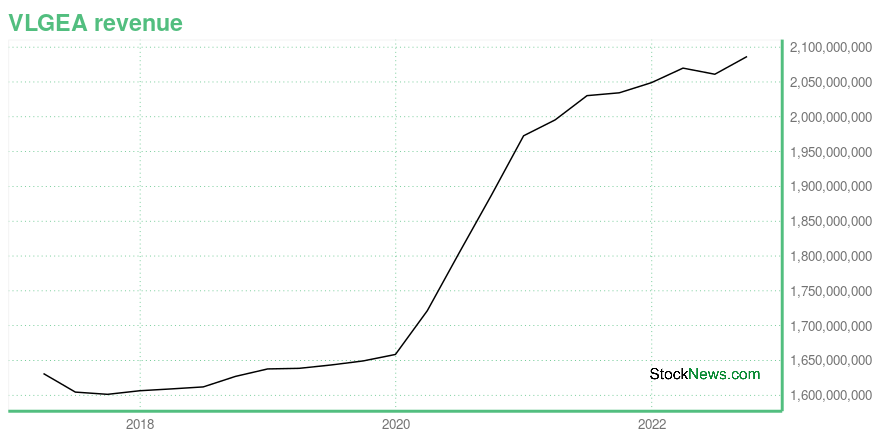
The table below shows VLGEA's growth in key financial areas (numbers in millions of US dollars).
| Date | Revenue | Operating Cash Flow | Net Income to Common Stock |
|---|---|---|---|
| 2022-09-30 | 2,086.562 | 93.757 | 30.582 |
| 2022-06-30 | 2,061.084 | 79.625 | 26.83 |
| 2022-03-31 | 2,069.864 | 71.399 | 23.73 |
| 2021-12-31 | 2,048.995 | 68.055 | 29.535 |
| 2021-09-30 | 2,034.405 | 63.932 | 23.961 |
| 2021-06-30 | 2,030.33 | 52.692 | 19.994 |
VLGEA's Quality Factors
The “Quality” component of the POWR Ratings focuses on 31 different factors of a companies fundamentals and operational strength. Here are some key insights as we drill into the specifics of these quality attributes.- VLGEA has a Quality Grade of B, ranking ahead of 76.78% of graded US stocks.
- VLGEA's asset turnover comes in at 2.264 -- ranking 31st of 165 Retail stocks.
- KSPN, NUZE, and FCFS are the stocks whose asset turnover ratios are most correlated with VLGEA.

The table below shows VLGEA's key quality metrics over time.
| Period | Asset Turnover | Gross Margin | ROIC |
|---|---|---|---|
| 2021-07-31 | 2.264 | 0.278 | 0.032 |
| 2021-04-24 | 2.209 | 0.280 | 0.028 |
| 2021-01-23 | 2.382 | 0.281 | 0.044 |
| 2020-10-24 | 2.521 | 0.281 | 0.046 |
| 2020-07-25 | 2.699 | 0.281 | 0.054 |
| 2020-04-25 | 3.046 | 0.277 | 0.073 |
Village Super Market, Inc. - (VLGEA) Company Bio
Village Super Market operates a chain of supermarkets in the United States. primarily in the northeast. The company was founded in 1933 and is based in Springfield, New Jersey.
Latest VLGEA News From Around the Web
Below are the latest news stories about VILLAGE SUPER MARKET INC that investors may wish to consider to help them evaluate VLGEA as an investment opportunity.
Village Super Market (NASDAQ:VLGE.A) Is Paying Out A Dividend Of $0.25The board of Village Super Market, Inc. ( NASDAQ:VLGE.A ) has announced that it will pay a dividend on the 25th of... |
Here's Why Village Super Market (NASDAQ:VLGE.A) Has Caught The Eye Of InvestorsThe excitement of investing in a company that can reverse its fortunes is a big draw for some speculators, so even... |
Village Super Market declares $0.25 dividendMore on Village Super Market |
Village Super Market, Inc. Reports Results for the First Quarter Ended October 28, 2023SPRINGFIELD, N.J., Dec. 05, 2023 (GLOBE NEWSWIRE) -- Village Super Market, Inc. (NASDAQ:VLGEA) (the "Company" or "Village") today reported its results of operations for the first quarter ended October 28, 2023. First Quarter Highlights Net income of $11.6 million, an increase of 5% compared to $11.1 million in the first quarter of the prior yearSales increased 3.2% and same store sales increased 2.0%Same store digital sales increased 13% First Quarter of Fiscal 2024 Results Sales were $536.4 mil |
A Look At The Intrinsic Value Of Village Super Market, Inc. (NASDAQ:VLGE.A)Key Insights The projected fair value for Village Super Market is US$25.00 based on Dividend Discount Model With... |
VLGEA Price Returns
| 1-mo | 0.78% |
| 3-mo | 7.02% |
| 6-mo | 14.13% |
| 1-year | 17.75% |
| 3-year | 28.46% |
| 5-year | 3.50% |
| YTD | -0.28% |
| 2023 | 17.66% |
| 2022 | 4.11% |
| 2021 | 9.46% |
| 2020 | -0.96% |
| 2019 | -8.94% |
VLGEA Dividends
| Ex-Dividend Date | Type | Payout Amount | Change | ||||||
|---|---|---|---|---|---|---|---|---|---|
| Loading, please wait... | |||||||||
Continue Researching VLGEA
Want to do more research on Village Super Market Inc's stock and its price? Try the links below:Village Super Market Inc (VLGEA) Stock Price | Nasdaq
Village Super Market Inc (VLGEA) Stock Quote, History and News - Yahoo Finance
Village Super Market Inc (VLGEA) Stock Price and Basic Information | MarketWatch
Loading social stream, please wait...