
QuinStreet, Inc. (QNST): Price and Financial Metrics
QNST Price/Volume Stats
| Current price | $15.55 | 52-week high | $18.10 |
| Prev. close | $15.39 | 52-week low | $6.79 |
| Day low | $15.01 | Volume | 295,300 |
| Day high | $15.61 | Avg. volume | 440,612 |
| 50-day MA | $12.95 | Dividend yield | N/A |
| 200-day MA | $10.37 | Market Cap | 853.56M |
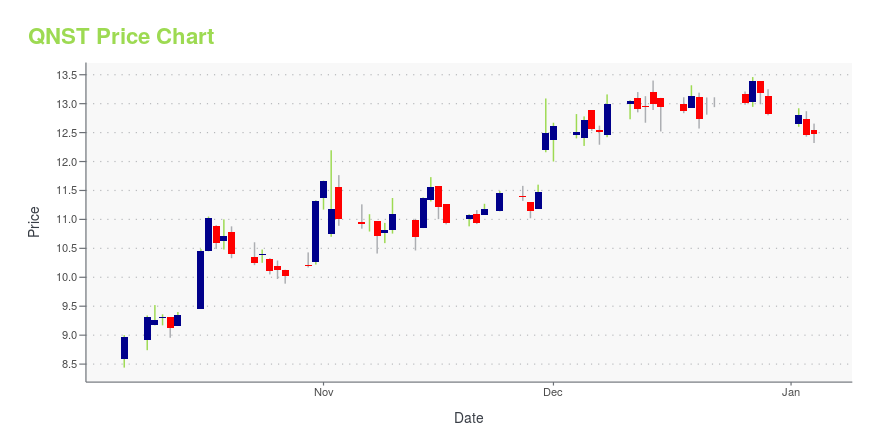
QNST Stock Price Chart Interactive Chart >
QNST POWR Grades
- QNST scores best on the Momentum dimension, with a Momentum rank ahead of 34.23% of US stocks.
- The strongest trend for QNST is in Growth, which has been heading down over the past 26 weeks.
- QNST ranks lowest in Quality; there it ranks in the 13th percentile.

QNST Stock Summary
- Price to trailing twelve month operating cash flow for QNST is currently 566.26, higher than 99.51% of US stocks with positive operating cash flow.
- The ratio of debt to operating expenses for QUINSTREET INC is higher than it is for about just 10.87% of US stocks.
- Over the past twelve months, QNST has reported earnings growth of 87.29%, putting it ahead of 88.33% of US stocks in our set.
- Stocks with similar financial metrics, market capitalization, and price volatility to QUINSTREET INC are KIND, PL, CHPT, LIDR, and ALKT.
- Visit QNST's SEC page to see the company's official filings. To visit the company's web site, go to quinstreet.com.
QNST Valuation Summary
- In comparison to the median Communication Services stock, QNST's EV/EBIT ratio is 257.89% lower, now standing at -25.5.
- QNST's price/sales ratio has moved down 1.1 over the prior 169 months.

Below are key valuation metrics over time for QNST.
| Stock | Date | P/S | P/B | P/E | EV/EBIT |
|---|---|---|---|---|---|
| QNST | 2023-12-29 | 1.2 | 3.1 | -9.3 | -25.5 |
| QNST | 2023-12-28 | 1.3 | 3.2 | -9.6 | -26.3 |
| QNST | 2023-12-27 | 1.3 | 3.3 | -9.8 | -26.8 |
| QNST | 2023-12-26 | 1.3 | 3.2 | -9.5 | -25.9 |
| QNST | 2023-12-22 | 1.3 | 3.2 | -9.5 | -26.0 |
| QNST | 2023-12-21 | 1.3 | 3.2 | -9.4 | -25.7 |
QNST Growth Metrics
- Its year over year cash and equivalents growth rate is now at 6.07%.
- Its 2 year revenue growth rate is now at 18.46%.
- Its 5 year cash and equivalents growth rate is now at 132.7%.
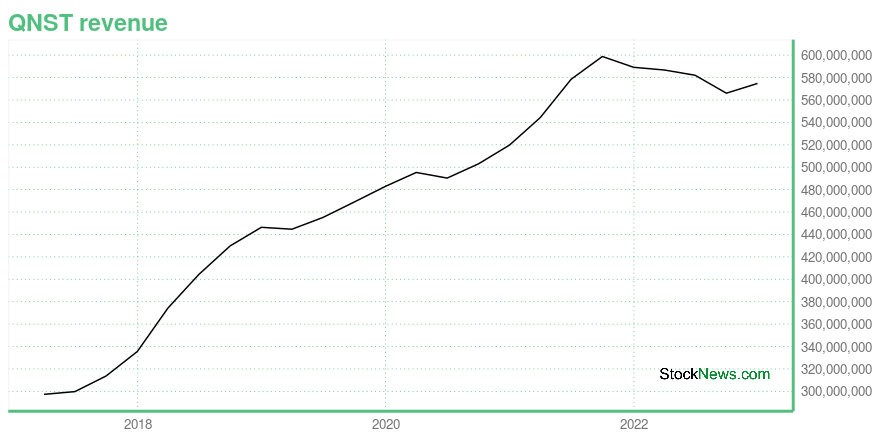
The table below shows QNST's growth in key financial areas (numbers in millions of US dollars).
| Date | Revenue | Operating Cash Flow | Net Income to Common Stock |
|---|---|---|---|
| 2022-12-31 | 574.801 | 12.185 | -15.209 |
| 2022-09-30 | 566.084 | 28.584 | -12.858 |
| 2022-06-30 | 582.099 | 28.672 | -5.248 |
| 2022-03-31 | 586.795 | 35.393 | 3.066 |
| 2021-12-31 | 589.189 | 47.165 | 5.873 |
| 2021-09-30 | 598.826 | 38.81 | 11.967 |
QNST's Quality Factors
The “Quality” component of the POWR Ratings focuses on 31 different factors of a companies fundamentals and operational strength. Here are some key insights as we drill into the specifics of these quality attributes.- QNST has a Quality Grade of C, ranking ahead of 60.53% of graded US stocks.
- QNST's asset turnover comes in at 1.342 -- ranking 64th of 561 Business Services stocks.
- EXEL, EGAN, and QADB are the stocks whose asset turnover ratios are most correlated with QNST.

The table below shows QNST's key quality metrics over time.
| Period | Asset Turnover | Gross Margin | ROIC |
|---|---|---|---|
| 2021-06-30 | 1.342 | 0.122 | 0.559 |
| 2021-03-31 | 1.333 | 0.117 | 0.484 |
| 2020-12-31 | 1.341 | 0.111 | 0.592 |
| 2020-09-30 | 1.364 | 0.112 | 0.575 |
| 2020-06-30 | 1.400 | 0.107 | 0.264 |
| 2020-03-31 | 1.450 | 0.111 | 0.290 |
QNST Price Target
For more insight on analysts targets of QNST, see our QNST price target page. And for a list of of all stocks sorted by upside potential based on analyst target price, see our Top Price Target page.
| Average Price Target | $26.80 | Average Broker Recommendation | 1.17 (Strong Buy) |
QuinStreet, Inc. (QNST) Company Bio
QuinStreet Inc. provides vertically oriented customer acquisition programs for its clients, primarily in the education and financial services area. The company was founded in 1999 and is based in Foster City, California.
Latest QNST News From Around the Web
Below are the latest news stories about QUINSTREET INC that investors may wish to consider to help them evaluate QNST as an investment opportunity.
QuinStreet Inc CFO Gregory Wong Sells 33,010 SharesOn December 18, 2023, Gregory Wong, the CFO of QuinStreet Inc (NASDAQ:QNST), sold 33,010 shares of the company's stock, according to a recent SEC Filing. |
Santa’s Salary Increases 5% to $170,583, Insure.com FindsFOSTER CITY, Calif., December 20, 2023--Insure.com, in its annual look at what St. Nick hypothetically makes based on a wage analysis of the tasks he performs, finds Santa’s salary increased 5% this year. |
Modernize Unveils In-Depth Homeowner Insights Report: A Guide to Future-Proofing Your BusinessAUSTIN, Texas, December 18, 2023--2023 Homeowner Insights Report shows homeowner motivations, preferences, and behaviors related to home improvements. |
QuinStreet (NASDAQ:QNST) investors are sitting on a loss of 36% if they invested three years agoQuinStreet, Inc. ( NASDAQ:QNST ) shareholders should be happy to see the share price up 17% in the last quarter. But... |
Zacks Industry Outlook Highlights GoDaddy, MakeMyTrip, QuinStreet and Asure SoftwareGoDaddy, MakeMyTrip, QuinStreet and Asure Software are part of the Zacks Industry Outlook article. |
QNST Price Returns
| 1-mo | 31.78% |
| 3-mo | 42.14% |
| 6-mo | 58.03% |
| 1-year | -13.42% |
| 3-year | -36.79% |
| 5-year | 12.84% |
| YTD | 21.29% |
| 2023 | -10.66% |
| 2022 | -21.11% |
| 2021 | -15.16% |
| 2020 | 40.04% |
| 2019 | -5.67% |
Continue Researching QNST
Want to see what other sources are saying about Quinstreet Inc's financials and stock price? Try the links below:Quinstreet Inc (QNST) Stock Price | Nasdaq
Quinstreet Inc (QNST) Stock Quote, History and News - Yahoo Finance
Quinstreet Inc (QNST) Stock Price and Basic Information | MarketWatch
Loading social stream, please wait...