
Silicon Laboratories, Inc. (SLAB): Price and Financial Metrics
SLAB Price/Volume Stats
| Current price | $139.75 | 52-week high | $186.29 |
| Prev. close | $141.95 | 52-week low | $74.56 |
| Day low | $138.62 | Volume | 261,300 |
| Day high | $142.30 | Avg. volume | 357,712 |
| 50-day MA | $127.85 | Dividend yield | N/A |
| 200-day MA | $128.97 | Market Cap | 4.44B |
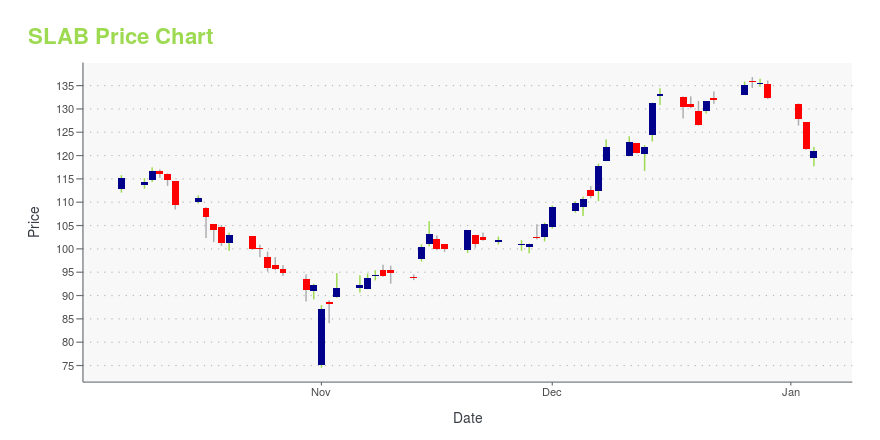
SLAB Stock Price Chart Interactive Chart >
SLAB POWR Grades
- SLAB scores best on the Momentum dimension, with a Momentum rank ahead of 86.94% of US stocks.
- The strongest trend for SLAB is in Quality, which has been heading down over the past 26 weeks.
- SLAB ranks lowest in Growth; there it ranks in the 2nd percentile.

SLAB Stock Summary
- With a price/earnings ratio of 63.68, SILICON LABORATORIES INC P/E ratio is greater than that of about 89.62% of stocks in our set with positive earnings.
- With a year-over-year growth in debt of -91.49%, SILICON LABORATORIES INC's debt growth rate surpasses merely 1.32% of about US stocks.
- SILICON LABORATORIES INC's shareholder yield -- a measure of how much capital is returned to stockholders via dividends and buybacks -- is 23.22%, greater than the shareholder yield of 92.6% of stocks in our set.
- Stocks with similar financial metrics, market capitalization, and price volatility to SILICON LABORATORIES INC are EXEL, DTIL, CRIS, EQ, and MRKR.
- SLAB's SEC filings can be seen here. And to visit SILICON LABORATORIES INC's official web site, go to www.silabs.com.
SLAB Valuation Summary
- In comparison to the median Technology stock, SLAB's price/earnings ratio is 139.77% higher, now standing at 63.9.
- SLAB's price/earnings ratio has moved up 2.3 over the prior 243 months.

Below are key valuation metrics over time for SLAB.
| Stock | Date | P/S | P/B | P/E | EV/EBIT |
|---|---|---|---|---|---|
| SLAB | 2023-12-08 | 4.1 | 3.1 | 63.9 | 40.8 |
| SLAB | 2023-12-07 | 3.9 | 3.0 | 61.7 | 39.3 |
| SLAB | 2023-12-06 | 3.7 | 2.8 | 58.4 | 37.1 |
| SLAB | 2023-12-05 | 3.7 | 2.8 | 58.0 | 36.9 |
| SLAB | 2023-12-04 | 3.7 | 2.8 | 57.6 | 36.6 |
| SLAB | 2023-12-01 | 3.6 | 2.8 | 57.2 | 36.4 |
SLAB Growth Metrics
- The 3 year cash and equivalents growth rate now stands at 231.36%.
- The year over year cash and equivalents growth rate now stands at 273.21%.
- Its year over year net cashflow from operations growth rate is now at -143.9%.
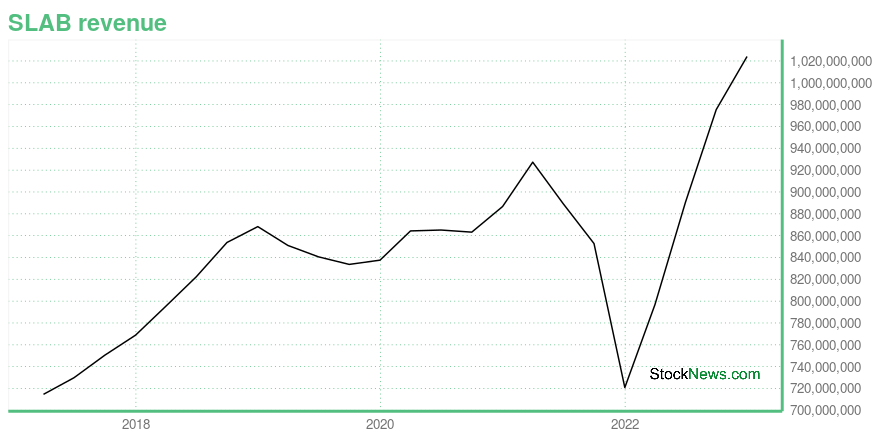
The table below shows SLAB's growth in key financial areas (numbers in millions of US dollars).
| Date | Revenue | Operating Cash Flow | Net Income to Common Stock |
|---|---|---|---|
| 2022-12-31 | 1,024.106 | 71.807 | 91.402 |
| 2022-09-30 | 975.461 | -160.424 | 62.943 |
| 2022-06-30 | 890.475 | -134.088 | 2,129 |
| 2022-03-31 | 796.817 | -39.741 | 2,126.797 |
| 2021-12-31 | 720.86 | -100.444 | 2,117.399 |
| 2021-09-30 | 852.745 | 126.684 | 2,129.445 |
SLAB's Quality Factors
The “Quality” component of the POWR Ratings focuses on 31 different factors of a companies fundamentals and operational strength. Here are some key insights as we drill into the specifics of these quality attributes.- SLAB has a Quality Grade of C, ranking ahead of 69.55% of graded US stocks.
- SLAB's asset turnover comes in at 0.363 -- ranking 164th of 208 Electronic Equipment stocks.
- AVNW, DQ, and SATS are the stocks whose asset turnover ratios are most correlated with SLAB.

The table below shows SLAB's key quality metrics over time.
| Period | Asset Turnover | Gross Margin | ROIC |
|---|---|---|---|
| 2021-10-02 | 0.363 | 0.584 | 1.567 |
| 2021-07-03 | 0.462 | 0.584 | 0.066 |
| 2021-04-03 | 0.480 | 0.592 | 0.054 |
| 2021-01-02 | 0.453 | 0.595 | 0.040 |
| 2020-10-03 | 0.460 | 0.601 | 0.038 |
| 2020-07-04 | 0.480 | 0.604 | 0.054 |
SLAB Price Target
For more insight on analysts targets of SLAB, see our SLAB price target page. And for a list of of all stocks sorted by upside potential based on analyst target price, see our Top Price Target page.
| Average Price Target | $171.80 | Average Broker Recommendation | 1.73 (Moderate Buy) |
Silicon Laboratories, Inc. (SLAB) Company Bio
Silicon Laboratories designs, develops, and markets mixed-signal analog intensive integrated circuits. The company was founded in 1996 and is based in Austin, Texas.
Latest SLAB News From Around the Web
Below are the latest news stories about SILICON LABORATORIES INC that investors may wish to consider to help them evaluate SLAB as an investment opportunity.
There's Reason For Concern Over Silicon Laboratories Inc.'s (NASDAQ:SLAB) Massive 33% Price JumpSilicon Laboratories Inc. ( NASDAQ:SLAB ) shareholders would be excited to see that the share price has had a great... |
Silicon Labs Announces CFO TransitionSilicon Labs (NASDAQ: SLAB), a leader in secure, intelligent wireless technology for a more connected world, announced that John Hollister will step down as chief financial officer (CFO) to join partner GlobalFoundries as its CFO. Mark Mauldin, Silicon Labs' chief accounting officer, will work closely with Hollister to transition responsibilities and will be named interim chief financial officer when the handover is completed by February 2, 2024. Silicon Labs is conducting a search for a new CFO |
Silicon Laboratories Inc.'s (NASDAQ:SLAB) Stock Is Going Strong: Have Financials A Role To Play?Silicon Laboratories (NASDAQ:SLAB) has had a great run on the share market with its stock up by a significant 21% over... |
Insider Sell Alert: President & CEO Robert Johnson Sells Shares of Silicon Laboratories Inc ...Robert Johnson, the President & CEO of Silicon Laboratories Inc, has recently made a significant change to his holdings in the company. |
Silicon Labs to Present at the Barclays Global Technology ConferenceSilicon Labs (NASDAQ: SLAB), a leader in secure, intelligent wireless technology for a more connected world, today announced that the company will present at the Barclays Global Technology Conference on Thursday, December 7th, 2023, at The Palace Hotel in San Francisco, CA. Matt Johnson, President and CEO, and Giovanni Pacelli, Senior Director of Finance, are scheduled to participate in a fireside chat at 9:50 a.m. Pacific Time. |
SLAB Price Returns
| 1-mo | 10.62% |
| 3-mo | 38.35% |
| 6-mo | 3.54% |
| 1-year | -22.07% |
| 3-year | -14.18% |
| 5-year | 61.32% |
| YTD | 5.66% |
| 2023 | -2.51% |
| 2022 | -34.27% |
| 2021 | 62.10% |
| 2020 | 9.79% |
| 2019 | 47.16% |
Continue Researching SLAB
Want to do more research on Silicon Laboratories Inc's stock and its price? Try the links below:Silicon Laboratories Inc (SLAB) Stock Price | Nasdaq
Silicon Laboratories Inc (SLAB) Stock Quote, History and News - Yahoo Finance
Silicon Laboratories Inc (SLAB) Stock Price and Basic Information | MarketWatch
Loading social stream, please wait...