
Lands' End, Inc. (LE): Price and Financial Metrics
LE Price/Volume Stats
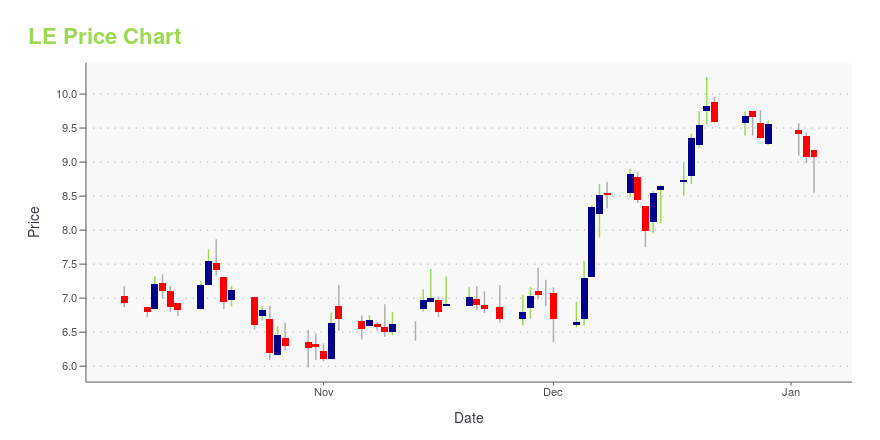
| Current price | $9.77 | 52-week high | $10.81 |
| Prev. close | $9.77 | 52-week low | $5.98 |
| Day low | $9.58 | Volume | 59,600 |
| Day high | $10.17 | Avg. volume | 56,903 |
| 50-day MA | $9.06 | Dividend yield | N/A |
| 200-day MA | $8.18 | Market Cap | 307.23M |
LE Stock Price Chart Interactive Chart >
LE POWR Grades
- LE scores best on the Value dimension, with a Value rank ahead of 85.41% of US stocks.
- The strongest trend for LE is in Quality, which has been heading up over the past 26 weeks.
- LE's current lowest rank is in the Stability metric (where it is better than 31.65% of US stocks).

LE Stock Summary
- LE's one year PEG ratio, measuring expected growth in earnings next year relative to current common stock price is 0.66 -- higher than only 6.18% of US-listed equities with positive expected earnings growth.
- With a price/sales ratio of 0.19, LANDS' END INC has a higher such ratio than merely 5.18% of stocks in our set.
- Over the past twelve months, LE has reported earnings growth of -344.74%, putting it ahead of merely 3.75% of US stocks in our set.
- Stocks with similar financial metrics, market capitalization, and price volatility to LANDS' END INC are NWL, CONN, ARKR, ATIF, and QRHC.
- Visit LE's SEC page to see the company's official filings. To visit the company's web site, go to www.landsend.com.
LE Valuation Summary
- LE's price/sales ratio is 0.2; this is 90% lower than that of the median Consumer Cyclical stock.
- LE's price/earnings ratio has moved down 16 over the prior 119 months.

Below are key valuation metrics over time for LE.
| Stock | Date | P/S | P/B | P/E | EV/EBIT |
|---|---|---|---|---|---|
| LE | 2023-12-29 | 0.2 | 1.2 | -2.4 | -8.8 |
| LE | 2023-12-28 | 0.2 | 1.2 | -2.3 | -8.7 |
| LE | 2023-12-27 | 0.2 | 1.2 | -2.4 | -8.8 |
| LE | 2023-12-26 | 0.2 | 1.2 | -2.4 | -8.8 |
| LE | 2023-12-22 | 0.2 | 1.2 | -2.4 | -8.8 |
| LE | 2023-12-21 | 0.2 | 1.2 | -2.5 | -8.9 |
LE Growth Metrics
- Its 5 year net income to common stockholders growth rate is now at 104.89%.
- The year over year cash and equivalents growth rate now stands at -37.23%.
- The 3 year revenue growth rate now stands at 14.48%.
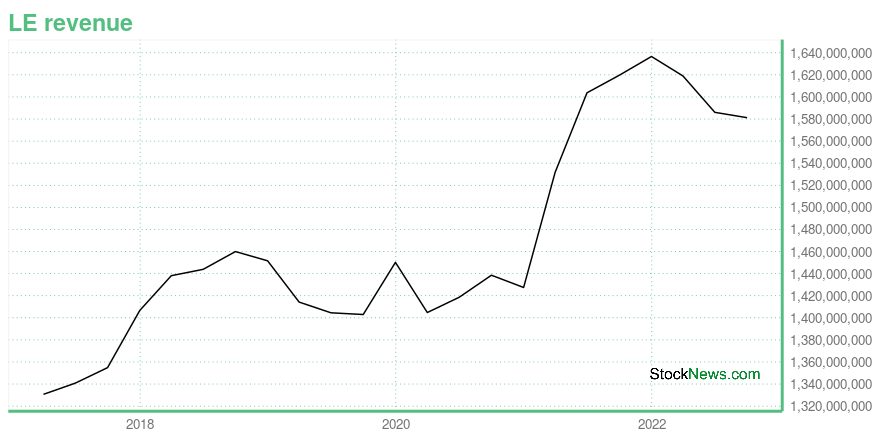
The table below shows LE's growth in key financial areas (numbers in millions of US dollars).
| Date | Revenue | Operating Cash Flow | Net Income to Common Stock |
|---|---|---|---|
| 2022-09-30 | 1,581.201 | -49.072 | -2.122 |
| 2022-06-30 | 1,586.061 | -77.481 | 9.959 |
| 2022-03-31 | 1,618.992 | -13.139 | 28.359 |
| 2021-12-31 | 1,636.624 | 70.569 | 33.369 |
| 2021-09-30 | 1,619.624 | 111.343 | 46.186 |
| 2021-06-30 | 1,603.763 | 114.174 | 45.963 |
LE's Quality Factors
The “Quality” component of the POWR Ratings focuses on 31 different factors of a companies fundamentals and operational strength. Here are some key insights as we drill into the specifics of these quality attributes.- LE has a Quality Grade of B, ranking ahead of 81.6% of graded US stocks.
- LE's asset turnover comes in at 1.457 -- ranking 82nd of 165 Retail stocks.
- KMX, AN, and SAH are the stocks whose asset turnover ratios are most correlated with LE.

The table below shows LE's key quality metrics over time.
| Period | Asset Turnover | Gross Margin | ROIC |
|---|---|---|---|
| 2021-07-30 | 1.457 | 0.438 | 0.132 |
| 2021-04-30 | 1.381 | 0.431 | 0.098 |
| 2021-01-29 | 1.277 | 0.424 | 0.055 |
| 2020-10-30 | 1.268 | 0.425 | 0.058 |
| 2020-07-31 | 1.261 | 0.425 | 0.047 |
| 2020-05-01 | 1.256 | 0.424 | 0.036 |
LE Price Target
For more insight on analysts targets of LE, see our LE price target page. And for a list of of all stocks sorted by upside potential based on analyst target price, see our Top Price Target page.
| Average Price Target | $45.00 | Average Broker Recommendation | 1.75 (Moderate Buy) |
Lands' End, Inc. (LE) Company Bio
Land's End is a multi-channel retailer in the United States and internationally, operating Direct and Retail. It offers casual clothing, accessories, footwear, and home products. The company was founded in 1963 and is based in Dodgeville, Wisconsin.
Latest LE News From Around the Web
Below are the latest news stories about LANDS' END INC that investors may wish to consider to help them evaluate LE as an investment opportunity.
Lands’ End, Inc. (NASDAQ:LE) Q3 2023 Earnings Call TranscriptLands’ End, Inc. (NASDAQ:LE) Q3 2023 Earnings Call Transcript December 5, 2023 Lands’ End, Inc. misses on earnings expectations. Reported EPS is $-0.18 EPS, expectations were $-0.16. Operator: Good day, everyone and welcome to the Lands’ End Third Quarter Earnings Conference Call. [Operator Instructions] Please note today’s call will be recorded, and I’ll be standing […] |
Q3 2023 Lands End Inc Earnings CallQ3 2023 Lands End Inc Earnings Call |
Lands' End (LE) Q3 2023 Earnings Call TranscriptLater, you will have the opportunity to ask questions during the question-and-answer session. It is now my pleasure to turn the conference over to Bernie McCracken, chief financial officer. Good morning, and thank you for joining the Lands' End earnings call for a discussion of our third-quarter 2023 results which we released this morning and can be found on our website, landsend.com. |
Lands' End Inc (LE) Reports Mixed Q3 Fiscal 2023 Results Amidst Strategic AdjustmentsNet Loss Widens Due to Goodwill Impairment, Yet Gross Margin and Inventory Management Show Improvement |
Lands’ End Announces Third Quarter Fiscal 2023 ResultsDODGEVILLE, Wis., Dec. 05, 2023 (GLOBE NEWSWIRE) -- Lands’ End, Inc. (NASDAQ: LE) today announced financial results for the third quarter ended October 27, 2023. Andrew McLean, Chief Executive Officer, stated, “Our third quarter results reflect the continued strong execution of our solutions-based strategy to deliver compelling product for our customers and value to our shareholders. Our deliberate efforts to generate more profitable sales resulted in increased gross profit dollars and gross mar |
LE Price Returns
| 1-mo | 13.08% |
| 3-mo | 41.59% |
| 6-mo | 1.45% |
| 1-year | 16.73% |
| 3-year | -69.35% |
| 5-year | -44.33% |
| YTD | 2.20% |
| 2023 | 25.96% |
| 2022 | -61.33% |
| 2021 | -8.99% |
| 2020 | 28.39% |
| 2019 | 18.23% |
Continue Researching LE
Here are a few links from around the web to help you further your research on Lands' End Inc's stock as an investment opportunity:Lands' End Inc (LE) Stock Price | Nasdaq
Lands' End Inc (LE) Stock Quote, History and News - Yahoo Finance
Lands' End Inc (LE) Stock Price and Basic Information | MarketWatch
Loading social stream, please wait...