
Squarespace, Inc. (SQSP): Price and Financial Metrics
SQSP Price/Volume Stats
| Current price | $31.60 | 52-week high | $34.38 |
| Prev. close | $32.96 | 52-week low | $22.65 |
| Day low | $31.50 | Volume | 568,000 |
| Day high | $32.74 | Avg. volume | 640,679 |
| 50-day MA | $31.16 | Dividend yield | N/A |
| 200-day MA | $30.15 | Market Cap | 4.30B |
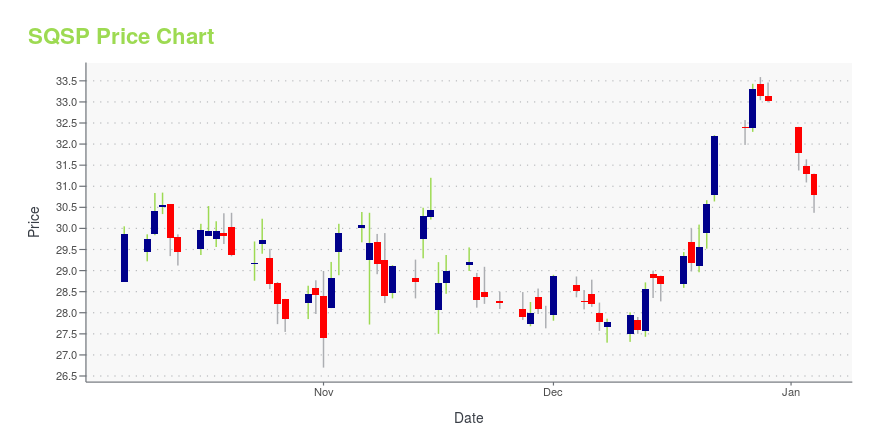
SQSP Stock Price Chart Interactive Chart >
SQSP POWR Grades
- Growth is the dimension where SQSP ranks best; there it ranks ahead of 89.38% of US stocks.
- The strongest trend for SQSP is in Quality, which has been heading down over the past 26 weeks.
- SQSP's current lowest rank is in the Sentiment metric (where it is better than 17.6% of US stocks).

SQSP Stock Summary
- The capital turnover (annual revenue relative to shareholder's equity) for SQSP is -3.37 -- better than just 3.57% of US stocks.
- SQSP's one year PEG ratio, measuring expected growth in earnings next year relative to current common stock price is 0.33 -- higher than only 3.88% of US-listed equities with positive expected earnings growth.
- Over the past twelve months, SQSP has reported earnings growth of -5,197.79%, putting it ahead of merely 0.32% of US stocks in our set.
- Stocks that are quantitatively similar to SQSP, based on their financial statements, market capitalization, and price volatility, are UPST, CTKB, NVRO, AKA, and SPIR.
- Visit SQSP's SEC page to see the company's official filings. To visit the company's web site, go to www.squarespace.com.
SQSP Valuation Summary
- SQSP's EV/EBIT ratio is -31.5; this is 248.58% lower than that of the median Technology stock.
- SQSP's price/earnings ratio has moved up 8.2 over the prior 31 months.

Below are key valuation metrics over time for SQSP.
| Stock | Date | P/S | P/B | P/E | EV/EBIT |
|---|---|---|---|---|---|
| SQSP | 2023-12-08 | 3.9 | -13.1 | -15.3 | -31.5 |
| SQSP | 2023-12-07 | 3.9 | -13.1 | -15.3 | -31.5 |
| SQSP | 2023-12-06 | 4.0 | -13.3 | -15.6 | -32.0 |
| SQSP | 2023-12-05 | 4.0 | -13.3 | -15.6 | -32.0 |
| SQSP | 2023-12-04 | 4.0 | -13.5 | -15.7 | -32.3 |
| SQSP | 2023-12-01 | 4.0 | -13.6 | -15.9 | -32.6 |
Squarespace, Inc. (SQSP) Company Bio
Squarespace, Inc. operates platform for businesses and independent creators to build online presence, grow their brands, and manage their businesses across the internet. The company offers websites, domains, e-commerce, tools for managing a social media presence, marketing tools, and scheduling capabilities. It serves small and medium-sized businesses, and independent creators, such as restaurants, photographers, wedding planners, artists, musicians, and bloggers. Squarespace, Inc. was founded in 2003 and is headquartered in New York, New York.
Latest SQSP News From Around the Web
Below are the latest news stories about SQUARESPACE INC that investors may wish to consider to help them evaluate SQSP as an investment opportunity.
Squarespace Inc CFO Nathan Gooden Sells 9,635 SharesNathan Gooden, the CFO of Squarespace Inc (NYSE:SQSP), executed a sale of 9,635 shares in the company on December 21, 2023, according to a SEC Filing. |
Squarespace Inc CFO Nathan Gooden Sells 9,921 SharesNathan Gooden, the CFO of Squarespace Inc (NYSE:SQSP), executed a sale of 9,921 shares in the company on December 20, 2023, according to a recent SEC Filing. |
Insider Sell Alert: CFO Nathan Gooden Sells 19,555 Shares of Squarespace Inc (SQSP)In a notable insider transaction, CFO Nathan Gooden of Squarespace Inc (NYSE:SQSP) sold 19,555 shares of the company on December 14, 2023. |
Squarespace, Inc. (NYSE:SQSP) Could Be Less Than A Year Away From ProfitabilitySquarespace, Inc. ( NYSE:SQSP ) is possibly approaching a major achievement in its business, so we would like to shine... |
Squarespace to Present at Barclays 2023 Global Technology ConferenceSquarespace, Inc. (NYSE: SQSP), the design-driven platform helping entrepreneurs build brands and businesses online, today announced that Nathan Gooden, CFO, will present at the Barclays Global Technology Conference on Wednesday, December 6, 2023 at 4:55 p.m. ET / 1:55 p.m. PT. |
SQSP Price Returns
| 1-mo | -0.25% |
| 3-mo | 11.62% |
| 6-mo | 5.54% |
| 1-year | 36.09% |
| 3-year | N/A |
| 5-year | N/A |
| YTD | -4.27% |
| 2023 | 48.89% |
| 2022 | -24.85% |
| 2021 | N/A |
| 2020 | N/A |
| 2019 | N/A |
Loading social stream, please wait...