
PDF Solutions, Inc. (PDFS): Price and Financial Metrics
PDFS Price/Volume Stats
| Current price | $35.07 | 52-week high | $48.02 |
| Prev. close | $34.96 | 52-week low | $26.12 |
| Day low | $31.41 | Volume | 770,200 |
| Day high | $35.20 | Avg. volume | 183,455 |
| 50-day MA | $31.85 | Dividend yield | N/A |
| 200-day MA | $35.34 | Market Cap | 1.34B |
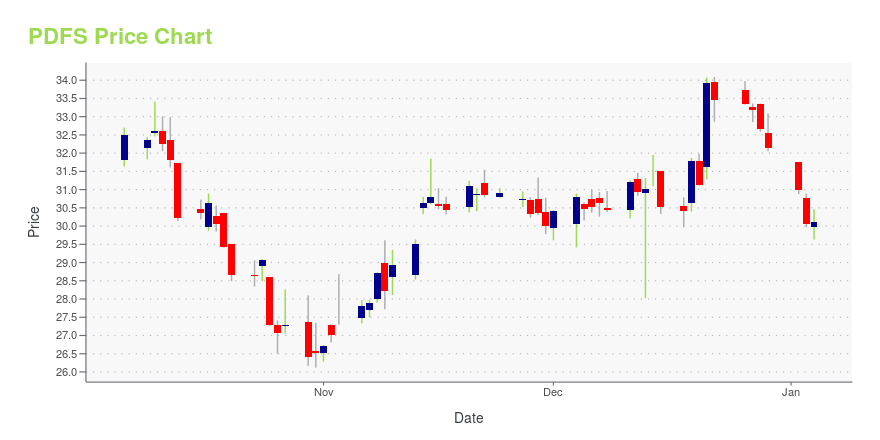
PDFS Stock Price Chart Interactive Chart >
PDFS POWR Grades
- PDFS scores best on the Sentiment dimension, with a Sentiment rank ahead of 95.96% of US stocks.
- PDFS's strongest trending metric is Growth; it's been moving down over the last 26 weeks.
- PDFS's current lowest rank is in the Value metric (where it is better than 37.69% of US stocks).

PDFS Stock Summary
- With a price/earnings ratio of 425.68, PDF SOLUTIONS INC P/E ratio is greater than that of about 98.69% of stocks in our set with positive earnings.
- The ratio of debt to operating expenses for PDF SOLUTIONS INC is higher than it is for about just 10.72% of US stocks.
- In terms of twelve month growth in earnings before interest and taxes, PDF SOLUTIONS INC is reporting a growth rate of -196.96%; that's higher than merely 6.68% of US stocks.
- Stocks that are quantitatively similar to PDFS, based on their financial statements, market capitalization, and price volatility, are HLIT, HQY, UEC, AGYS, and QDEL.
- Visit PDFS's SEC page to see the company's official filings. To visit the company's web site, go to www.pdf.com.
PDFS Valuation Summary
- In comparison to the median Technology stock, PDFS's EV/EBIT ratio is 761.79% higher, now standing at 182.7.
- Over the past 243 months, PDFS's price/sales ratio has gone down 0.6.

Below are key valuation metrics over time for PDFS.
| Stock | Date | P/S | P/B | P/E | EV/EBIT |
|---|---|---|---|---|---|
| PDFS | 2023-12-08 | 7.1 | 5.3 | 431.4 | 182.7 |
| PDFS | 2023-12-07 | 7.1 | 5.3 | 434.0 | 184.0 |
| PDFS | 2023-12-06 | 7.1 | 5.3 | 432.2 | 183.1 |
| PDFS | 2023-12-05 | 7.1 | 5.3 | 431.8 | 182.9 |
| PDFS | 2023-12-04 | 7.1 | 5.3 | 436.2 | 185.0 |
| PDFS | 2023-12-01 | 7.0 | 5.2 | 430.6 | 182.4 |
PDFS Growth Metrics
- Its 4 year cash and equivalents growth rate is now at -12.65%.
- Its 5 year cash and equivalents growth rate is now at -12.65%.
- Its year over year net income to common stockholders growth rate is now at 61.96%.
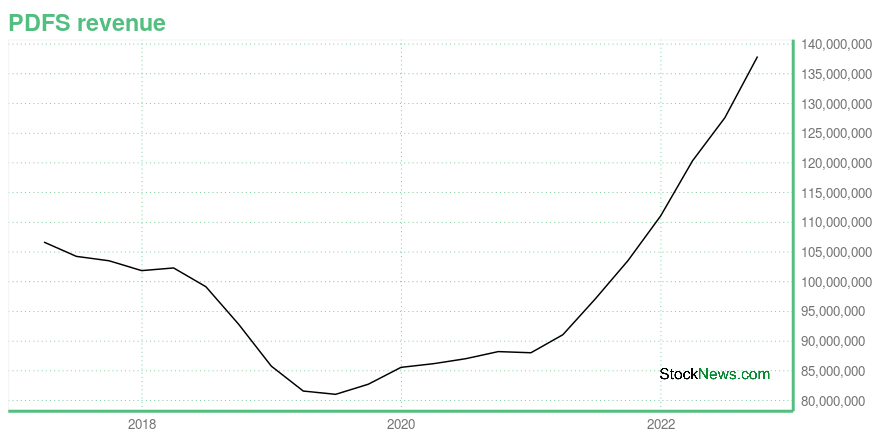
The table below shows PDFS's growth in key financial areas (numbers in millions of US dollars).
| Date | Revenue | Operating Cash Flow | Net Income to Common Stock |
|---|---|---|---|
| 2022-09-30 | 137.912 | 8.439 | -10.912 |
| 2022-06-30 | 127.607 | 11.058 | -14.704 |
| 2022-03-31 | 120.358 | 15.564 | -18.041 |
| 2021-12-31 | 111.06 | 4.243 | -21.488 |
| 2021-09-30 | 103.542 | 14.734 | -47.937 |
| 2021-06-30 | 97.099 | 10.958 | -48.264 |
PDFS's Quality Factors
The “Quality” component of the POWR Ratings focuses on 31 different factors of a companies fundamentals and operational strength. Here are some key insights as we drill into the specifics of these quality attributes.- PDFS has a Quality Grade of C, ranking ahead of 46.17% of graded US stocks.
- PDFS's asset turnover comes in at 0.34 -- ranking 408th of 563 Business Services stocks.
- WSC, RPD, and SPLK are the stocks whose asset turnover ratios are most correlated with PDFS.

The table below shows PDFS's key quality metrics over time.
| Period | Asset Turnover | Gross Margin | ROIC |
|---|---|---|---|
| 2021-06-30 | 0.340 | 0.580 | -0.147 |
| 2021-03-31 | 0.330 | 0.572 | -0.142 |
| 2020-12-31 | 0.329 | 0.582 | -0.128 |
| 2020-09-30 | 0.345 | 0.592 | -0.103 |
| 2020-06-30 | 0.370 | 0.596 | -0.093 |
| 2020-03-31 | 0.368 | 0.604 | -0.075 |
PDFS Price Target
For more insight on analysts targets of PDFS, see our PDFS price target page. And for a list of of all stocks sorted by upside potential based on analyst target price, see our Top Price Target page.
| Average Price Target | $26.75 | Average Broker Recommendation | 1.5 (Moderate Buy) |
PDF Solutions, Inc. (PDFS) Company Bio
PDF Solutions, Inc. engages in the provision of an end-to-end analytics platform that empowers engineers and data scientists across the semiconductor ecosystem and data analytics for process-design optimization and yield enhancement. Its products, services and platforms include proprietary software, physical intellectual property (or IP) for integrated circuit (or IC) designs, electrical measurement hardware tools, proven methodologies, and professional services.
Latest PDFS News From Around the Web
Below are the latest news stories about PDF SOLUTIONS INC that investors may wish to consider to help them evaluate PDFS as an investment opportunity.
12 High Growth Semiconductor Stocks That Are ProfitableIn this article, we discuss the 12 high-growth semiconductor stocks that are profitable. To skip the detailed analysis of the semiconductor industry, go directly to the 5 High Growth Semiconductor Stocks That Are Profitable. Semiconductors are a global need and their supply is required by every sector of the market. The industry has been facing […] |
Insider Sell Alert: Director Michael Gustafson Sells Shares of PDF Solutions IncIn the intricate dance of the stock market, insider transactions often attract the attention of investors seeking clues about a company's future prospects. |
We Like These Underlying Return On Capital Trends At PDF Solutions (NASDAQ:PDFS)Did you know there are some financial metrics that can provide clues of a potential multi-bagger? Typically, we'll want... |
PDF Solutions, Inc. (NASDAQ:PDFS) Q3 2023 Earnings Call TranscriptPDF Solutions, Inc. (NASDAQ:PDFS) Q3 2023 Earnings Call Transcript November 12, 2023 Operator: Good day, everyone, and welcome to the PDF Solutions, Inc. Conference Call to discuss its Financial Results for the Third Quarter ending Saturday, September 30, 2023. [Operator Instructions]. As a reminder, this conference is being recorded. If you have not yet received […] |
At US$28.22, Is PDF Solutions, Inc. (NASDAQ:PDFS) Worth Looking At Closely?PDF Solutions, Inc. ( NASDAQ:PDFS ), is not the largest company out there, but it saw significant share price movement... |
PDFS Price Returns
| 1-mo | 10.77% |
| 3-mo | 13.53% |
| 6-mo | 0.57% |
| 1-year | -6.18% |
| 3-year | 91.33% |
| 5-year | 182.37% |
| YTD | 9.12% |
| 2023 | 12.69% |
| 2022 | -10.29% |
| 2021 | 47.18% |
| 2020 | 27.89% |
| 2019 | 100.36% |
Continue Researching PDFS
Want to see what other sources are saying about Pdf Solutions Inc's financials and stock price? Try the links below:Pdf Solutions Inc (PDFS) Stock Price | Nasdaq
Pdf Solutions Inc (PDFS) Stock Quote, History and News - Yahoo Finance
Pdf Solutions Inc (PDFS) Stock Price and Basic Information | MarketWatch
Loading social stream, please wait...