
Cara Therapeutics, Inc. (CARA): Price and Financial Metrics
CARA Price/Volume Stats
| Current price | $0.63 | 52-week high | $10.83 |
| Prev. close | $0.60 | 52-week low | $0.50 |
| Day low | $0.56 | Volume | 538,500 |
| Day high | $0.64 | Avg. volume | 593,867 |
| 50-day MA | $0.70 | Dividend yield | N/A |
| 200-day MA | $2.01 | Market Cap | 34.12M |
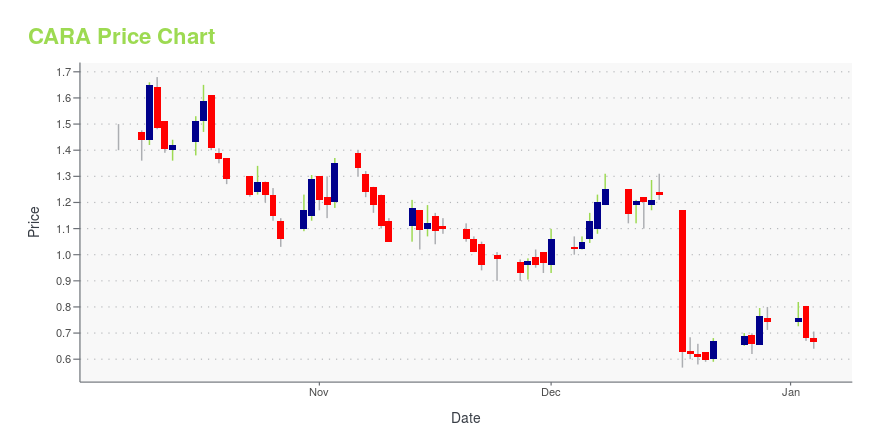
CARA Stock Price Chart Interactive Chart >
CARA POWR Grades
- Value is the dimension where CARA ranks best; there it ranks ahead of 76.67% of US stocks.
- The strongest trend for CARA is in Growth, which has been heading up over the past 26 weeks.
- CARA ranks lowest in Stability; there it ranks in the 4th percentile.

CARA Stock Summary
- With a year-over-year growth in debt of 208.13%, CARA THERAPEUTICS INC's debt growth rate surpasses 95.75% of about US stocks.
- Revenue growth over the past 12 months for CARA THERAPEUTICS INC comes in at -46.17%, a number that bests merely 5.34% of the US stocks we're tracking.
- In terms of volatility of its share price, CARA is more volatile than 92.95% of stocks we're observing.
- If you're looking for stocks that are quantitatively similar to CARA THERAPEUTICS INC, a group of peers worth examining would be GRTS, QURE, TCRX, KRTX, and LIFE.
- CARA's SEC filings can be seen here. And to visit CARA THERAPEUTICS INC's official web site, go to www.caratherapeutics.com.
CARA Valuation Summary
- CARA's price/sales ratio is 1.9; this is 13.64% lower than that of the median Healthcare stock.
- CARA's price/sales ratio has moved down 21.7 over the prior 121 months.

Below are key valuation metrics over time for CARA.
| Stock | Date | P/S | P/B | P/E | EV/EBIT |
|---|---|---|---|---|---|
| CARA | 2023-12-29 | 1.9 | 0.5 | -0.3 | 0.1 |
| CARA | 2023-12-28 | 2.0 | 0.5 | -0.4 | 0.1 |
| CARA | 2023-12-27 | 1.7 | 0.4 | -0.3 | 0.2 |
| CARA | 2023-12-26 | 1.8 | 0.4 | -0.3 | 0.2 |
| CARA | 2023-12-22 | 1.7 | 0.4 | -0.3 | 0.2 |
| CARA | 2023-12-21 | 1.5 | 0.4 | -0.3 | 0.2 |
CARA Growth Metrics
- Its 2 year net cashflow from operations growth rate is now at 48.43%.
- Its 4 year price growth rate is now at 5.62%.
- The 2 year net income to common stockholders growth rate now stands at 18.04%.

The table below shows CARA's growth in key financial areas (numbers in millions of US dollars).
| Date | Revenue | Operating Cash Flow | Net Income to Common Stock |
|---|---|---|---|
| 2022-09-30 | 39.427 | -56.465 | -88.517 |
| 2022-06-30 | 48.886 | -45.389 | -66.35 |
| 2022-03-31 | 25.883 | -61.891 | -92.889 |
| 2021-12-31 | 23.028 | -60.087 | -88.441 |
| 2021-09-30 | 134.296 | 23.246 | 23.85 |
| 2021-06-30 | 123.29 | 15.742 | 8.354 |
CARA's Quality Factors
The “Quality” component of the POWR Ratings focuses on 31 different factors of a companies fundamentals and operational strength. Here are some key insights as we drill into the specifics of these quality attributes.- CARA has a Quality Grade of C, ranking ahead of 32.88% of graded US stocks.
- CARA's asset turnover comes in at 0.554 -- ranking 69th of 682 Pharmaceutical Products stocks.
- APLS, FENC, and FSTX are the stocks whose asset turnover ratios are most correlated with CARA.

The table below shows CARA's key quality metrics over time.
| Period | Asset Turnover | Gross Margin | ROIC |
|---|---|---|---|
| 2021-06-30 | 0.554 | 1 | 0.046 |
| 2021-03-31 | 0.616 | 1 | 0.091 |
| 2020-12-31 | 0.690 | 1 | 0.059 |
| 2020-09-30 | 0.148 | 1 | -0.840 |
| 2020-06-30 | 0.112 | 1 | -0.773 |
| 2020-03-31 | 0.112 | 1 | -0.754 |
CARA Price Target
For more insight on analysts targets of CARA, see our CARA price target page. And for a list of of all stocks sorted by upside potential based on analyst target price, see our Top Price Target page.
| Average Price Target | $26.33 | Average Broker Recommendation | 1.44 (Moderate Buy) |
Cara Therapeutics, Inc. (CARA) Company Bio
Cara Therapeutics is a clinical-stage biopharmaceutical company focused on developing and commercializing new chemical entities designed to alleviate pain and pruritus by selectively targeting kappa opioid receptors. The company was founded in 2004 and is based in Shelton, Connecticut.
Latest CARA News From Around the Web
Below are the latest news stories about CARA THERAPEUTICS INC that investors may wish to consider to help them evaluate CARA as an investment opportunity.
CARA's Late-Stage Skin Disease Study Fails, Stock Plummets 49%CARA discontinues the clinical program of oral difelikefalin for pruritus associated with atopic dermatitis following the failure of dose-finding Part A of the late-stage study. Stock plunges 49%. |
Cara Therapeutics Announces Outcome from Dose-Finding Part A of KIND 1 Study Evaluating Oral Difelikefalin for Moderate-to-Severe Pruritus in Patients with Atopic Dermatitis– Oral difelikefalin as adjunct to topical corticosteroids (TCS) did not demonstrate meaningful clinical benefit compared to TCS alone; As a result, Cara will discontinue its clinical program in pruritus associated with atopic dermatitis – – Late-stage oral difelikefalin clinical programs for pruritus associated with notalgia paresthetica and advanced chronic kidney disease continue to enroll on track with key data readouts expected in 2H24 – – Cara expects to end 2023 with approximately $100 mi |
Cara Therapeutics, Inc. (NASDAQ:CARA) Q3 2023 Earnings Call TranscriptCara Therapeutics, Inc. (NASDAQ:CARA) Q3 2023 Earnings Call Transcript November 13, 2023 Cara Therapeutics, Inc. misses on earnings expectations. Reported EPS is $-0.52 EPS, expectations were $-0.5. Operator: Good afternoon. My name is Latif and I will be your conference facilitator. I would like to welcome everyone to the Cara Therapeutics Third Quarter Financial Results […] |
Q3 2023 Cara Therapeutics Inc Earnings CallQ3 2023 Cara Therapeutics Inc Earnings Call |
Cara (CARA) Reports Q3 Earnings: What Key Metrics Have to SayThe headline numbers for Cara (CARA) give insight into how the company performed in the quarter ended September 2023, but it may be worthwhile to compare some of its key metrics to Wall Street estimates and the year-ago actuals. |
CARA Price Returns
| 1-mo | 11.50% |
| 3-mo | -37.62% |
| 6-mo | -79.07% |
| 1-year | -94.14% |
| 3-year | -96.85% |
| 5-year | -96.19% |
| YTD | -15.21% |
| 2023 | -93.08% |
| 2022 | -11.82% |
| 2021 | -19.50% |
| 2020 | -6.08% |
| 2019 | 23.92% |
Continue Researching CARA
Want to do more research on Cara Therapeutics Inc's stock and its price? Try the links below:Cara Therapeutics Inc (CARA) Stock Price | Nasdaq
Cara Therapeutics Inc (CARA) Stock Quote, History and News - Yahoo Finance
Cara Therapeutics Inc (CARA) Stock Price and Basic Information | MarketWatch
Loading social stream, please wait...