
Eversource Energy (ES): Price and Financial Metrics
ES Price/Volume Stats
| Current price | $58.87 | 52-week high | $81.36 |
| Prev. close | $58.62 | 52-week low | $52.03 |
| Day low | $57.60 | Volume | 5,241,800 |
| Day high | $58.97 | Avg. volume | 3,681,236 |
| 50-day MA | $58.12 | Dividend yield | 4.59% |
| 200-day MA | $63.29 | Market Cap | 20.59B |
ES Stock Price Chart Interactive Chart >

ES POWR Grades
- Stability is the dimension where ES ranks best; there it ranks ahead of 44.32% of US stocks.
- The strongest trend for ES is in Stability, which has been heading down over the past 26 weeks.
- ES's current lowest rank is in the Growth metric (where it is better than 12.3% of US stocks).

ES Stock Summary
- EVERSOURCE ENERGY's stock had its IPO on January 1, 1986, making it an older stock than 92.92% of US equities in our set.
- Of note is the ratio of EVERSOURCE ENERGY's sales and general administrative expense to its total operating expenses; only 0.17% of US stocks have a lower such ratio.
- For ES, its debt to operating expenses ratio is greater than that reported by 96.1% of US equities we're observing.
- Stocks with similar financial metrics, market capitalization, and price volatility to EVERSOURCE ENERGY are CNP, CMS, AWK, ETR, and PEG.
- ES's SEC filings can be seen here. And to visit EVERSOURCE ENERGY's official web site, go to www.eversource.com.
ES Valuation Summary
- ES's price/sales ratio is 1.8; this is 18.18% lower than that of the median Utilities stock.
- ES's price/earnings ratio has moved up 4.4 over the prior 243 months.

Below are key valuation metrics over time for ES.
| Stock | Date | P/S | P/B | P/E | EV/EBIT |
|---|---|---|---|---|---|
| ES | 2023-12-27 | 1.8 | 1.4 | 18.4 | 20.6 |
| ES | 2023-12-26 | 1.8 | 1.4 | 18.4 | 20.6 |
| ES | 2023-12-22 | 1.7 | 1.4 | 18.3 | 20.5 |
| ES | 2023-12-21 | 1.7 | 1.4 | 18.2 | 20.5 |
| ES | 2023-12-20 | 1.7 | 1.3 | 18.1 | 20.4 |
| ES | 2023-12-19 | 1.8 | 1.4 | 18.4 | 20.6 |
ES Growth Metrics
- Its 5 year net income to common stockholders growth rate is now at -2.35%.
- Its 4 year price growth rate is now at 30.63%.
- Its 3 year net cashflow from operations growth rate is now at -5.46%.
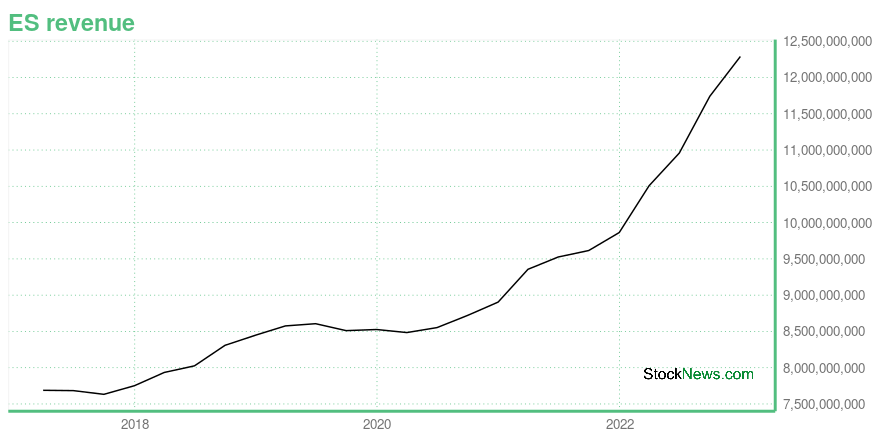
The table below shows ES's growth in key financial areas (numbers in millions of US dollars).
| Date | Revenue | Operating Cash Flow | Net Income to Common Stock |
|---|---|---|---|
| 2022-12-31 | 12,289.34 | 2,401.293 | 1,404.875 |
| 2022-09-30 | 11,741.51 | 2,131.231 | 1,391.415 |
| 2022-06-30 | 10,958.66 | 1,996.974 | 1,325.172 |
| 2022-03-31 | 10,508.56 | 1,923.124 | 1,297.83 |
| 2021-12-31 | 9,863.085 | 1,962.6 | 1,220.527 |
| 2021-09-30 | 9,615.105 | 1,706.636 | 1,185.752 |
ES's Quality Factors
The “Quality” component of the POWR Ratings focuses on 31 different factors of a companies fundamentals and operational strength. Here are some key insights as we drill into the specifics of these quality attributes.- ES has a Quality Grade of C, ranking ahead of 32.69% of graded US stocks.
- ES's asset turnover comes in at 0.208 -- ranking 59th of 105 Utilities stocks.
- NI, CMS, and PNW are the stocks whose asset turnover ratios are most correlated with ES.

The table below shows ES's key quality metrics over time.
| Period | Asset Turnover | Gross Margin | ROIC |
|---|---|---|---|
| 2021-06-30 | 0.208 | 0.410 | 0.040 |
| 2021-03-31 | 0.210 | 0.413 | 0.041 |
| 2020-12-31 | 0.206 | 0.414 | 0.041 |
| 2020-09-30 | 0.207 | 0.412 | 0.042 |
| 2020-06-30 | 0.208 | 0.412 | 0.041 |
| 2020-03-31 | 0.210 | 0.408 | 0.037 |
ES Price Target
For more insight on analysts targets of ES, see our ES price target page. And for a list of of all stocks sorted by upside potential based on analyst target price, see our Top Price Target page.
| Average Price Target | $91.39 | Average Broker Recommendation | 1.77 (Moderate Buy) |
Eversource Energy (ES) Company Bio
Eversource Energy is a publicly traded, Fortune 500 energy company headquartered in Hartford, Connecticut, and Boston, Massachusetts, with several regulated subsidiaries offering retail electricity, natural gas service and water service to approximately 4 million customers in Connecticut, Massachusetts and New Hampshire. (Source:Wikipedia)
Latest ES News From Around the Web
Below are the latest news stories about EVERSOURCE ENERGY that investors may wish to consider to help them evaluate ES as an investment opportunity.
The 7 Best Reddit Stocks to Buy NowThese best Reddit stocks to buy are defying the usual high-risk investing stereotype and offer strong upside ahead for investors. |
Eversource Recognized as a "5 Year Champion" of Corporate Responsibility by NewsweekHARTFORD, Conn. & BOSTON, December 27, 2023--Eversource Energy is again among top utilities on Newsweek’s 2024 list of "Most Responsible Companies," appearing every year since it was introduced. |
Cautious Investors Not Rewarding Eversource Energy's (NYSE:ES) Performance CompletelyThere wouldn't be many who think Eversource Energy's ( NYSE:ES ) price-to-earnings (or "P/E") ratio of 18.5x is worth a... |
Eversource Energy's Dividend AnalysisEversource Energy (NYSE:ES) recently announced a dividend of $0.68 per share, payable on 2023-12-29, with the ex-dividend date set for 2023-12-15. As investors look forward to this upcoming payment, the spotlight also shines on the company's dividend history, yield, and growth rates. Using the data from GuruFocus, let's look into Eversource Energy's dividend performance and assess its sustainability. |
Why Is Eversource (ES) Up 6.8% Since Last Earnings Report?Eversource (ES) reported earnings 30 days ago. What's next for the stock? We take a look at earnings estimates for some clues. |
ES Price Returns
| 1-mo | 10.22% |
| 3-mo | 1.16% |
| 6-mo | -6.23% |
| 1-year | -23.71% |
| 3-year | -20.34% |
| 5-year | -2.47% |
| YTD | -4.62% |
| 2023 | -23.43% |
| 2022 | -5.06% |
| 2021 | 8.19% |
| 2020 | 4.44% |
| 2019 | 34.49% |
ES Dividends
| Ex-Dividend Date | Type | Payout Amount | Change | ||||||
|---|---|---|---|---|---|---|---|---|---|
| Loading, please wait... | |||||||||
Continue Researching ES
Want to do more research on Eversource Energy's stock and its price? Try the links below:Eversource Energy (ES) Stock Price | Nasdaq
Eversource Energy (ES) Stock Quote, History and News - Yahoo Finance
Eversource Energy (ES) Stock Price and Basic Information | MarketWatch
Loading social stream, please wait...