
Nu Skin Enterprises, Inc. (NUS): Price and Financial Metrics
NUS Price/Volume Stats
| Current price | $13.69 | 52-week high | $43.76 |
| Prev. close | $13.82 | 52-week low | $13.37 |
| Day low | $13.52 | Volume | 2,150,000 |
| Day high | $14.64 | Avg. volume | 757,627 |
| 50-day MA | $18.34 | Dividend yield | 11.4% |
| 200-day MA | $24.14 | Market Cap | 676.41M |
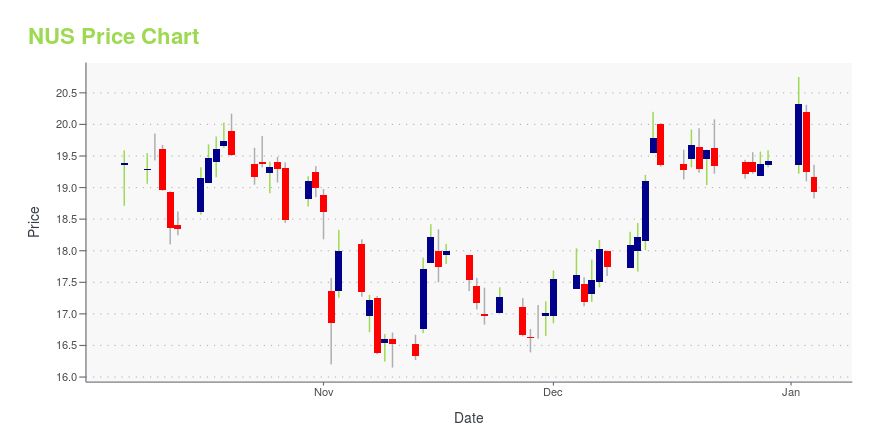
NUS Stock Price Chart Interactive Chart >
NUS POWR Grades
- NUS scores best on the Value dimension, with a Value rank ahead of 98.45% of US stocks.
- The strongest trend for NUS is in Value, which has been heading up over the past 26 weeks.
- NUS ranks lowest in Sentiment; there it ranks in the 1st percentile.

NUS Stock Summary
- NUS's price/sales ratio is 0.47; that's higher than the P/S ratio of merely 15.72% of US stocks.
- As for revenue growth, note that NUS's revenue has grown -15.73% over the past 12 months; that beats the revenue growth of merely 16.43% of US companies in our set.
- The volatility of NU SKIN ENTERPRISES INC's share price is greater than that of 85.18% US stocks with at least 200 days of trading history.
- Stocks that are quantitatively similar to NUS, based on their financial statements, market capitalization, and price volatility, are LZB, COLM, SCVL, BSET, and ETD.
- Visit NUS's SEC page to see the company's official filings. To visit the company's web site, go to www.nuskin.com.
NUS Valuation Summary
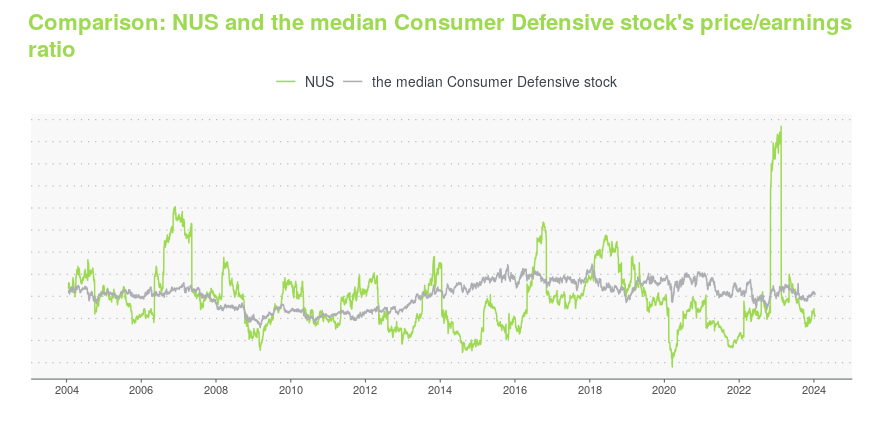
- In comparison to the median Consumer Defensive stock, NUS's price/earnings ratio is 22.01% lower, now standing at 16.3.
- Over the past 243 months, NUS's price/sales ratio has gone down 0.8.
Below are key valuation metrics over time for NUS.
| Stock | Date | P/S | P/B | P/E | EV/EBIT |
|---|---|---|---|---|---|
| NUS | 2023-12-22 | 0.5 | 1.2 | 16.3 | 31.1 |
| NUS | 2023-12-21 | 0.5 | 1.2 | 16.5 | 31.4 |
| NUS | 2023-12-20 | 0.5 | 1.2 | 16.3 | 31.0 |
| NUS | 2023-12-19 | 0.5 | 1.2 | 16.6 | 31.5 |
| NUS | 2023-12-18 | 0.5 | 1.2 | 16.3 | 31.0 |
| NUS | 2023-12-15 | 0.5 | 1.2 | 16.3 | 31.1 |
NUS Growth Metrics
- The year over year net cashflow from operations growth rate now stands at -42.33%.
- The 3 year cash and equivalents growth rate now stands at -2.6%.
- Its 4 year price growth rate is now at -35.4%.
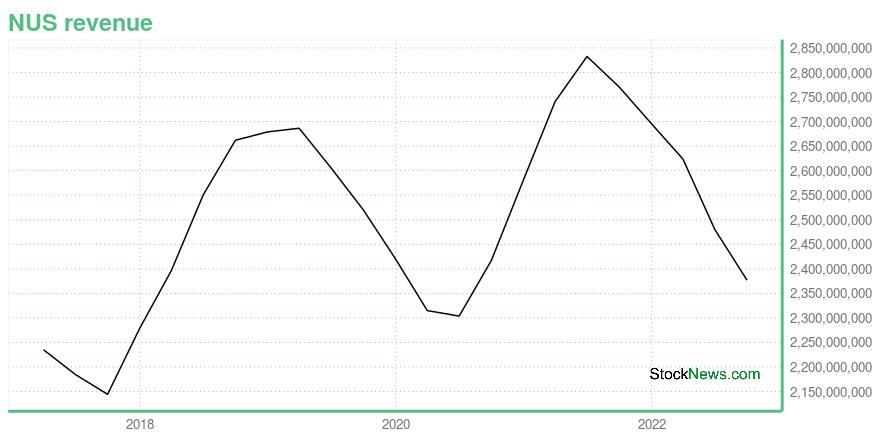
The table below shows NUS's growth in key financial areas (numbers in millions of US dollars).
| Date | Revenue | Operating Cash Flow | Net Income to Common Stock |
|---|---|---|---|
| 2022-09-30 | 2,376.755 | 192.046 | 38.332 |
| 2022-06-30 | 2,480.102 | 193.819 | 113.451 |
| 2022-03-31 | 2,623.542 | 167.979 | 138.552 |
| 2021-12-31 | 2,695.669 | 141.582 | 147.266 |
| 2021-09-30 | 2,770.426 | 126.766 | 229.964 |
| 2021-06-30 | 2,832.621 | 214.919 | 236.542 |
NUS's Quality Factors
The “Quality” component of the POWR Ratings focuses on 31 different factors of a companies fundamentals and operational strength. Here are some key insights as we drill into the specifics of these quality attributes.- NUS has a Quality Grade of A, ranking ahead of 96.07% of graded US stocks.
- NUS's asset turnover comes in at 1.458 -- ranking 55th of 105 Wholesale stocks.
- SCHN, LKQ, and GPC are the stocks whose asset turnover ratios are most correlated with NUS.

The table below shows NUS's key quality metrics over time.
| Period | Asset Turnover | Gross Margin | ROIC |
|---|---|---|---|
| 2021-06-30 | 1.458 | 0.746 | 0.254 |
| 2021-03-31 | 1.458 | 0.744 | 0.243 |
| 2020-12-31 | 1.412 | 0.745 | 0.216 |
| 2020-09-30 | 1.357 | 0.750 | 0.180 |
| 2020-06-30 | 1.308 | 0.757 | 0.170 |
| 2020-03-31 | 1.315 | 0.758 | 0.178 |
NUS Price Target
For more insight on analysts targets of NUS, see our NUS price target page. And for a list of of all stocks sorted by upside potential based on analyst target price, see our Top Price Target page.
| Average Price Target | $65.20 | Average Broker Recommendation | 1.7 (Moderate Buy) |
Nu Skin Enterprises, Inc. (NUS) Company Bio
Nu Skin Enterprises develops and distributes anti-aging personal care products and nutritional supplements under the Nu Skin and Pharmanex brands worldwide. The company was founded in 1984 and is based in Provo, Utah.
Latest NUS News From Around the Web
Below are the latest news stories about NU SKIN ENTERPRISES INC that investors may wish to consider to help them evaluate NUS as an investment opportunity.
Is Nu Skin Enterprises, Inc. (NYSE:NUS) Trading At A 25% Discount?Key Insights Using the Dividend Discount Model, Nu Skin Enterprises fair value estimate is US$25.74 Current share price... |
Nu Skin (NUS) Down More Than 20% in 3 Months: Here's WhyNu Skin (NUS) is battling escalating macroeconomic pressures, which are hampering key markets of the core business. Unfavorable currency translations remain a major concern. |
10 Cheap Dividend Stocks with High YieldsIn this article, we discuss 10 cheap dividend stocks with high yields. You can skip our detailed analysis of dividend stocks and their performance in the past, and go directly to read 5 Cheap Dividend Stocks with High Yields. In 2022, value stocks did better than growth stocks, marking the first time of value outperformance […] |
Why Is Inter Parfums (IPAR) Up 2.8% Since Last Earnings Report?Inter Parfums (IPAR) reported earnings 30 days ago. What's next for the stock? We take a look at earnings estimates for some clues. |
Investors in Nu Skin Enterprises (NYSE:NUS) have unfortunately lost 66% over the last five yearsStatistically speaking, long term investing is a profitable endeavour. But that doesn't mean long term investors can... |
NUS Price Returns
| 1-mo | -21.23% |
| 3-mo | -18.46% |
| 6-mo | -39.65% |
| 1-year | -66.76% |
| 3-year | -68.71% |
| 5-year | -73.28% |
| YTD | -29.51% |
| 2023 | -51.07% |
| 2022 | -13.92% |
| 2021 | -4.32% |
| 2020 | 38.67% |
| 2019 | -30.98% |
NUS Dividends
| Ex-Dividend Date | Type | Payout Amount | Change | ||||||
|---|---|---|---|---|---|---|---|---|---|
| Loading, please wait... | |||||||||
Continue Researching NUS
Here are a few links from around the web to help you further your research on Nu Skin Enterprises Inc's stock as an investment opportunity:Nu Skin Enterprises Inc (NUS) Stock Price | Nasdaq
Nu Skin Enterprises Inc (NUS) Stock Quote, History and News - Yahoo Finance
Nu Skin Enterprises Inc (NUS) Stock Price and Basic Information | MarketWatch
Loading social stream, please wait...