
TripAdvisor, Inc. (TRIP): Price and Financial Metrics
TRIP Price/Volume Stats
| Current price | $26.75 | 52-week high | $28.20 |
| Prev. close | $27.66 | 52-week low | $14.15 |
| Day low | $26.41 | Volume | 5,385,600 |
| Day high | $27.49 | Avg. volume | 2,902,821 |
| 50-day MA | $21.13 | Dividend yield | N/A |
| 200-day MA | $17.57 | Market Cap | 3.71B |
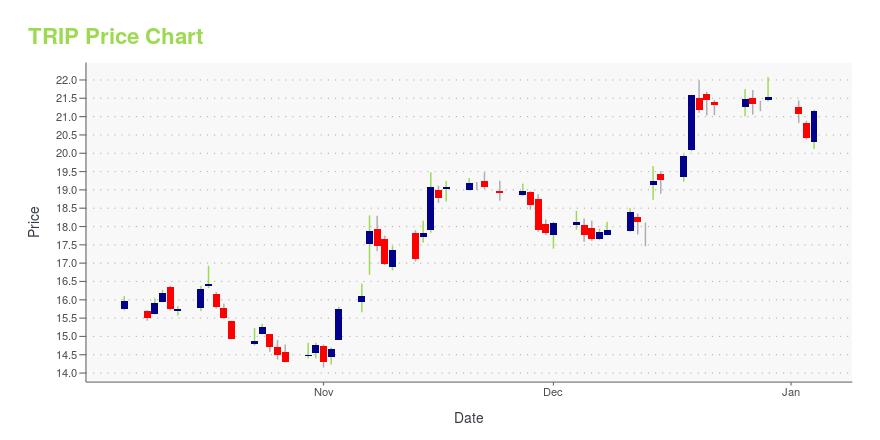
TRIP Stock Price Chart Interactive Chart >
TRIP POWR Grades
- Quality is the dimension where TRIP ranks best; there it ranks ahead of 97.88% of US stocks.
- TRIP's strongest trending metric is Value; it's been moving down over the last 26 weeks.
- TRIP ranks lowest in Stability; there it ranks in the 11th percentile.

TRIP Stock Summary
- The capital turnover (annual revenue relative to shareholder's equity) for TRIP is 2.13 -- better than 73.34% of US stocks.
- Over the past twelve months, TRIP has reported earnings growth of 51.25%, putting it ahead of 82.37% of US stocks in our set.
- Revenue growth over the past 12 months for TRIPADVISOR INC comes in at 27.05%, a number that bests 82.89% of the US stocks we're tracking.
- Stocks that are quantitatively similar to TRIP, based on their financial statements, market capitalization, and price volatility, are VERX, LUNA, OB, SWI, and KTOS.
- TRIP's SEC filings can be seen here. And to visit TRIPADVISOR INC's official web site, go to www.tripadvisor.com.
TRIP Valuation Summary
- In comparison to the median Industrials stock, TRIP's price/sales ratio is 19.05% lower, now standing at 1.7.
- TRIP's price/earnings ratio has moved down 146.9 over the prior 147 months.

Below are key valuation metrics over time for TRIP.
| Stock | Date | P/S | P/B | P/E | EV/EBIT |
|---|---|---|---|---|---|
| TRIP | 2023-12-29 | 1.7 | 3.6 | -124.3 | 22.8 |
| TRIP | 2023-12-28 | 1.7 | 3.6 | -123.1 | 22.6 |
| TRIP | 2023-12-27 | 1.7 | 3.6 | -123.2 | 22.6 |
| TRIP | 2023-12-26 | 1.7 | 3.6 | -123.9 | 22.7 |
| TRIP | 2023-12-22 | 1.7 | 3.6 | -123.0 | 22.5 |
| TRIP | 2023-12-21 | 1.7 | 3.6 | -123.7 | 22.7 |
TRIP Growth Metrics
- Its 4 year cash and equivalents growth rate is now at 9.17%.
- The 4 year net cashflow from operations growth rate now stands at -48.66%.
- Its year over year cash and equivalents growth rate is now at 15.88%.

The table below shows TRIP's growth in key financial areas (numbers in millions of US dollars).
| Date | Revenue | Operating Cash Flow | Net Income to Common Stock |
|---|---|---|---|
| 2022-09-30 | 1,379 | 505 | -7 |
| 2022-06-30 | 1,223 | 382 | -31 |
| 2022-03-31 | 1,041 | 213 | -102 |
| 2021-12-31 | 902 | 108 | -148 |
| 2021-09-30 | 777 | 29 | -191 |
| 2021-06-30 | 625 | 60 | -240 |
TRIP's Quality Factors
The “Quality” component of the POWR Ratings focuses on 31 different factors of a companies fundamentals and operational strength. Here are some key insights as we drill into the specifics of these quality attributes.- TRIP has a Quality Grade of B, ranking ahead of 86.22% of graded US stocks.
- TRIP's asset turnover comes in at 0.291 -- ranking 440th of 563 Business Services stocks.
- MODN, VVI, and III are the stocks whose asset turnover ratios are most correlated with TRIP.

The table below shows TRIP's key quality metrics over time.
| Period | Asset Turnover | Gross Margin | ROIC |
|---|---|---|---|
| 2021-06-30 | 0.291 | 0.909 | -0.238 |
| 2021-03-31 | 0.213 | 0.893 | -0.374 |
| 2020-12-31 | 0.280 | 0.909 | -0.334 |
| 2020-09-30 | 0.380 | 0.923 | -0.264 |
| 2020-06-30 | 0.482 | 0.932 | -0.143 |
| 2020-03-31 | 0.620 | 0.937 | 0.307 |
TRIP Price Target
For more insight on analysts targets of TRIP, see our TRIP price target page. And for a list of of all stocks sorted by upside potential based on analyst target price, see our Top Price Target page.
| Average Price Target | $42.94 | Average Broker Recommendation | 1.89 (Hold) |
TripAdvisor, Inc. (TRIP) Company Bio
TripAdvisor operates as an online travel company. The company operates through two segments, Hotel and Other. Its travel research platform aggregates reviews and opinions about accommodations, destinations, activities and attractions, and restaurants that enable consumers to plan and book hotels, vacation rentals, flights, activities and attractions, and restaurants. The company was founded in 2000 and is based in Newton, Massachusetts.
Latest TRIP News From Around the Web
Below are the latest news stories about TRIPADVISOR INC that investors may wish to consider to help them evaluate TRIP as an investment opportunity.
Let's Take a Cruise Through the Charts of TripAdvisorLet's keep that idea in mind as we look at the charts and indicators of TripAdvisor . In this daily bar chart of TRIP, below, I can see that prices have broken out on the upside from a "sloppy" base pattern. The On-Balance-Volume (OBV) line shows us a stair step higher advance from August signalling that traders have been more aggressive buyers of TRIP the past few months. |
Capital Allocation Trends At Tripadvisor (NASDAQ:TRIP) Aren't IdealIf you're looking at a mature business that's past the growth phase, what are some of the underlying trends that pop... |
Set Sail for Profits: 3 Top Cruise Stocks Charting a Course for GrowthThese cruise stocks have been showing exceptional financial results and signs of growth in the quarters to come. |
Tripadvisor Stock Clears Technical Benchmark, Hitting 80-Plus RS RatingTripadvisor had its Relative Strength (RS) Rating upgraded from 78 to 81 Tuesday, before the market opened. IBD's proprietary rating identifies share price action with a 1 (worst) to 99 (best) score. Decades of market research reveals that the best stocks typically have an RS Rating north of 80 as they begin their biggest climbs. |
Tripadvisor Group names Kristen Dalton as President of the Tripadvisor Core BusinessTripadvisor, Inc. (NASDAQ: TRIP) announced today that Kristen Dalton will be appointed President of the Tripadvisor Core business on January 1, 2024, reporting to Matt Goldberg, CEO of Tripadvisor Group. Dalton most recently served as COO of the Tripadvisor Core business where she has been instrumental in setting the organization's strategy to transform the business. |
TRIP Price Returns
| 1-mo | 27.14% |
| 3-mo | 40.49% |
| 6-mo | 74.38% |
| 1-year | 22.20% |
| 3-year | -32.99% |
| 5-year | -51.71% |
| YTD | 24.25% |
| 2023 | 19.74% |
| 2022 | -34.04% |
| 2021 | -5.28% |
| 2020 | -5.27% |
| 2019 | -43.68% |
Continue Researching TRIP
Here are a few links from around the web to help you further your research on TripAdvisor Inc's stock as an investment opportunity:TripAdvisor Inc (TRIP) Stock Price | Nasdaq
TripAdvisor Inc (TRIP) Stock Quote, History and News - Yahoo Finance
TripAdvisor Inc (TRIP) Stock Price and Basic Information | MarketWatch
Loading social stream, please wait...