
CompX International Inc. (CIX): Price and Financial Metrics
CIX Price/Volume Stats
| Current price | $24.19 | 52-week high | $30.65 |
| Prev. close | $26.06 | 52-week low | $16.25 |
| Day low | $24.19 | Volume | 13,100 |
| Day high | $26.27 | Avg. volume | 12,497 |
| 50-day MA | $23.78 | Dividend yield | 4.13% |
| 200-day MA | $21.38 | Market Cap | 297.88M |
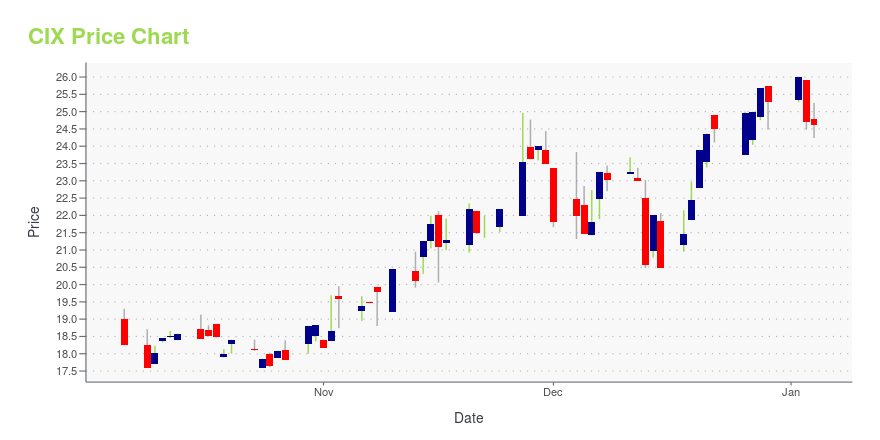
CIX Stock Price Chart Interactive Chart >
CIX POWR Grades
- Momentum is the dimension where CIX ranks best; there it ranks ahead of 99.42% of US stocks.
- The strongest trend for CIX is in Stability, which has been heading down over the past 26 weeks.
- CIX's current lowest rank is in the Value metric (where it is better than 54.01% of US stocks).

CIX Stock Summary
- Of note is the ratio of COMPX INTERNATIONAL INC's sales and general administrative expense to its total operating expenses; 87.34% of US stocks have a lower such ratio.
- The ratio of debt to operating expenses for COMPX INTERNATIONAL INC is higher than it is for about just 0.22% of US stocks.
- CIX's equity multiplier -- a measure of assets relative to shareholders'equity -- is greater than that of only 9.41% of US stocks.
- Stocks with similar financial metrics, market capitalization, and price volatility to COMPX INTERNATIONAL INC are WAFU, TR, TLF, RGR, and ETD.
- Visit CIX's SEC page to see the company's official filings. To visit the company's web site, go to www.compx.com.
CIX Valuation Summary
- CIX's EV/EBIT ratio is 10.8; this is 37.93% lower than that of the median Industrials stock.
- CIX's price/sales ratio has moved up 1.5 over the prior 243 months.

Below are key valuation metrics over time for CIX.
| Stock | Date | P/S | P/B | P/E | EV/EBIT |
|---|---|---|---|---|---|
| CIX | 2023-12-29 | 2.0 | 1.9 | 15.1 | 10.8 |
| CIX | 2023-12-28 | 2.0 | 1.9 | 15.3 | 11.0 |
| CIX | 2023-12-27 | 1.9 | 1.9 | 14.9 | 10.7 |
| CIX | 2023-12-26 | 1.9 | 1.9 | 14.9 | 10.7 |
| CIX | 2023-12-22 | 1.9 | 1.8 | 14.6 | 10.4 |
| CIX | 2023-12-21 | 1.9 | 1.8 | 14.5 | 10.4 |
CIX Growth Metrics
- Its year over year price growth rate is now at 8.29%.
- The 5 year price growth rate now stands at -4.57%.
- The year over year revenue growth rate now stands at 24.37%.
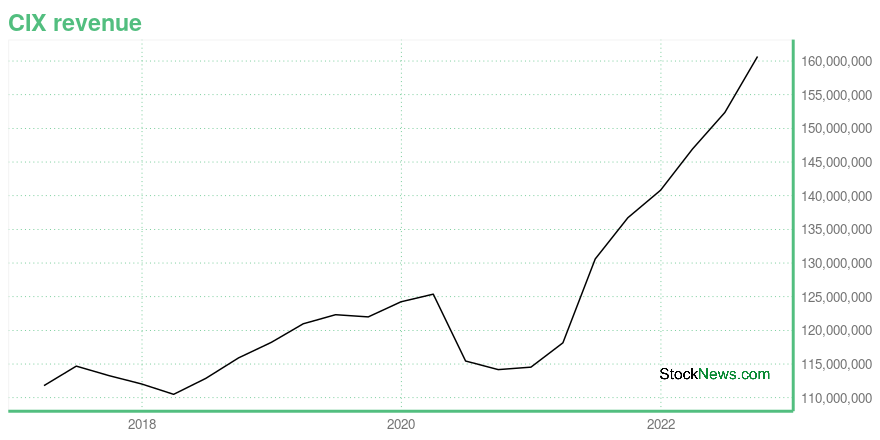
The table below shows CIX's growth in key financial areas (numbers in millions of US dollars).
| Date | Revenue | Operating Cash Flow | Net Income to Common Stock |
|---|---|---|---|
| 2022-09-30 | 160.671 | 10.501 | 19.241 |
| 2022-06-30 | 152.363 | 8.439 | 18.423 |
| 2022-03-31 | 146.941 | 10.689 | 16.867 |
| 2021-12-31 | 140.815 | 10.474 | 16.568 |
| 2021-09-30 | 136.733 | 14.352 | 15.592 |
| 2021-06-30 | 130.603 | 14.118 | 13.292 |
CompX International Inc. (CIX) Company Bio
CompX International Inc. engages in the manufacture and sale of security products and recreational marine components primarily in North America. The company operates through two segments, Security Products and Marine Components. The company was founded in 1993 and is based in Dallas, Texas.
Latest CIX News From Around the Web
Below are the latest news stories about COMPX INTERNATIONAL INC that investors may wish to consider to help them evaluate CIX as an investment opportunity.
Compx International Inc (CIX) Reports Q3 2023 Earnings: Sales Down, Net Income UpA detailed look at Compx International Inc's third quarter 2023 earnings |
COMPX REPORTS THIRD QUARTER 2023 RESULTSDallas, Texas, Nov. 01, 2023 (GLOBE NEWSWIRE) -- CompX International Inc. (NYSE American: CIX) announced today sales of $40.3 million for the third quarter of 2023 compared to $42.9 million in the same period of 2022. Operating income was $6.6 million in the third quarter of 2023 compared to $6.0 million in the same period of 2022. Net income was $5.8 million, or $.47 per basic and diluted common share, for the third quarter of 2023 compared to $4.9 million, or $.40 per basic and diluted common |
Compx International Inc: A High-Performing Stock with a GF Score of 93GF Score analysis |
COMPX REPORTS SECOND QUARTER 2023 RESULTSDallas, Texas, Aug. 01, 2023 (GLOBE NEWSWIRE) -- CompX International Inc. (NYSE American: CIX) announced today sales of $36.6 million for the second quarter of 2023 compared to $41.6 million in the same period of 2022. Operating income was $4.4 million in the second quarter of 2023 compared to $7.7 million in the same period of 2022. Net income was $4.0 million, or $.33 per basic and diluted common share, for the second quarter of 2023 compared to $6.2 million, or $.50 per basic and diluted comm |
Compx International: A Safe Industrial Stock With a High Dividend YieldThe stock has the highest possible Piotroski F-Score, showing stellar fundamentals |
CIX Price Returns
| 1-mo | 8.67% |
| 3-mo | 13.80% |
| 6-mo | 14.48% |
| 1-year | 31.86% |
| 3-year | 105.75% |
| 5-year | 105.43% |
| YTD | -4.31% |
| 2023 | 43.62% |
| 2022 | -7.98% |
| 2021 | 64.41% |
| 2020 | 0.31% |
| 2019 | 9.21% |
CIX Dividends
| Ex-Dividend Date | Type | Payout Amount | Change | ||||||
|---|---|---|---|---|---|---|---|---|---|
| Loading, please wait... | |||||||||
Continue Researching CIX
Want to do more research on Compx International Inc's stock and its price? Try the links below:Compx International Inc (CIX) Stock Price | Nasdaq
Compx International Inc (CIX) Stock Quote, History and News - Yahoo Finance
Compx International Inc (CIX) Stock Price and Basic Information | MarketWatch
Loading social stream, please wait...