
Bristol-Myers Squibb Co. (BMY): Price and Financial Metrics
BMY Price/Volume Stats
| Current price | $49.86 | 52-week high | $71.98 |
| Prev. close | $49.44 | 52-week low | $47.58 |
| Day low | $48.93 | Volume | 13,176,500 |
| Day high | $49.87 | Avg. volume | 15,873,069 |
| 50-day MA | $50.38 | Dividend yield | 4.81% |
| 200-day MA | $57.57 | Market Cap | 100.83B |
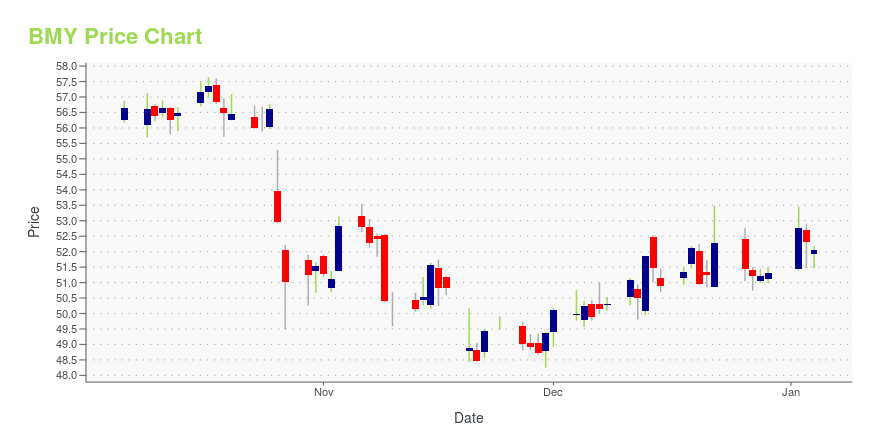
BMY Stock Price Chart Interactive Chart >
BMY POWR Grades
- Value is the dimension where BMY ranks best; there it ranks ahead of 99.18% of US stocks.
- BMY's strongest trending metric is Stability; it's been moving down over the last 26 weeks.
- BMY ranks lowest in Momentum; there it ranks in the 10th percentile.

BMY Stock Summary
- BRISTOL MYERS SQUIBB CO's market capitalization of $106,417,829,907 is ahead of 97.74% of US-listed equities.
- BRISTOL MYERS SQUIBB CO's stock had its IPO on January 1, 1986, making it an older stock than 92.92% of US equities in our set.
- Of note is the ratio of BRISTOL MYERS SQUIBB CO's sales and general administrative expense to its total operating expenses; only 13.7% of US stocks have a lower such ratio.
- Stocks that are quantitatively similar to BMY, based on their financial statements, market capitalization, and price volatility, are ADI, GILD, ABNB, MELI, and VALE.
- BMY's SEC filings can be seen here. And to visit BRISTOL MYERS SQUIBB CO's official web site, go to www.bms.com.
BMY Valuation Summary
- BMY's EV/EBIT ratio is 15.6; this is 6.85% higher than that of the median Healthcare stock.
- Over the past 243 months, BMY's price/earnings ratio has gone down 7.2.

Below are key valuation metrics over time for BMY.
| Stock | Date | P/S | P/B | P/E | EV/EBIT |
|---|---|---|---|---|---|
| BMY | 2023-12-29 | 2.3 | 3.6 | 12.6 | 15.6 |
| BMY | 2023-12-28 | 2.3 | 3.6 | 12.6 | 15.6 |
| BMY | 2023-12-27 | 2.3 | 3.6 | 12.6 | 15.6 |
| BMY | 2023-12-26 | 2.3 | 3.6 | 12.6 | 15.7 |
| BMY | 2023-12-22 | 2.4 | 3.7 | 12.8 | 15.9 |
| BMY | 2023-12-21 | 2.3 | 3.6 | 12.6 | 15.6 |
BMY Growth Metrics
- The 4 year cash and equivalents growth rate now stands at 304.53%.
- Its 3 year net cashflow from operations growth rate is now at 163.12%.
- The 2 year net cashflow from operations growth rate now stands at 53.2%.
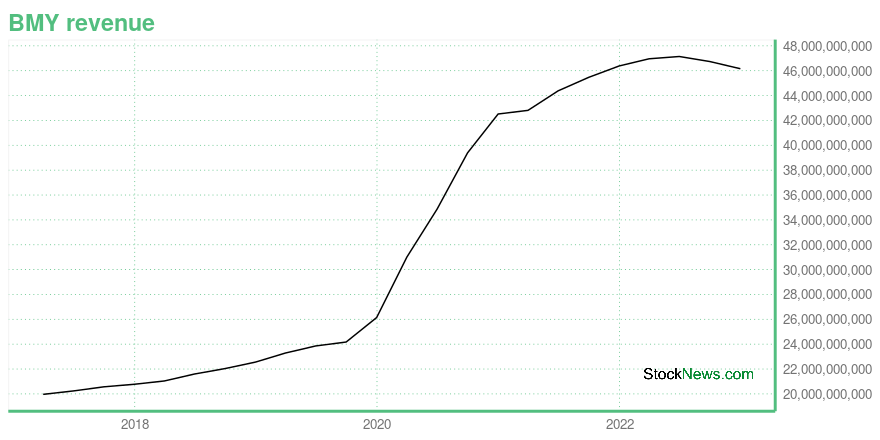
The table below shows BMY's growth in key financial areas (numbers in millions of US dollars).
| Date | Revenue | Operating Cash Flow | Net Income to Common Stock |
|---|---|---|---|
| 2022-12-31 | 46,159 | 13,066 | 6,327 |
| 2022-09-30 | 46,738 | 13,817 | 6,677 |
| 2022-06-30 | 47,144 | 15,396 | 6,617 |
| 2022-03-31 | 46,960 | 16,195 | 6,251 |
| 2021-12-31 | 46,385 | 16,207 | 6,994 |
| 2021-09-30 | 45,468 | 15,820 | -5,405 |
BMY's Quality Factors
The “Quality” component of the POWR Ratings focuses on 31 different factors of a companies fundamentals and operational strength. Here are some key insights as we drill into the specifics of these quality attributes.- BMY has a Quality Grade of B, ranking ahead of 79.64% of graded US stocks.
- BMY's asset turnover comes in at 0.38 -- ranking 124th of 680 Pharmaceutical Products stocks.
- PAHC, ACUR, and XLRN are the stocks whose asset turnover ratios are most correlated with BMY.

The table below shows BMY's key quality metrics over time.
| Period | Asset Turnover | Gross Margin | ROIC |
|---|---|---|---|
| 2021-06-30 | 0.380 | 0.759 | -0.071 |
| 2021-03-31 | 0.353 | 0.744 | -0.072 |
| 2020-12-31 | 0.339 | 0.723 | -0.123 |
| 2020-09-30 | 0.307 | 0.713 | 0.062 |
| 2020-06-30 | 0.314 | 0.696 | 0.050 |
| 2020-03-31 | 0.334 | 0.681 | 0.058 |
BMY Price Target
For more insight on analysts targets of BMY, see our BMY price target page. And for a list of of all stocks sorted by upside potential based on analyst target price, see our Top Price Target page.
| Average Price Target | $80.06 | Average Broker Recommendation | 1.47 (Moderate Buy) |
Bristol-Myers Squibb Co. (BMY) Company Bio
Bristol Myers Squibb (BMS) is an American multinational pharmaceutical company, headquartered in New York City. BMS is one of the world's largest pharmaceutical companies, and is consistently ranked on the Fortune 500 list of the largest U.S. corporations. As of September 2020, it had the total revenue of $39.3 billion. (Source:Wikipedia)
Latest BMY News From Around the Web
Below are the latest news stories about BRISTOL MYERS SQUIBB CO that investors may wish to consider to help them evaluate BMY as an investment opportunity.
Cytokinetics (CYTK) Up 83% as Cardiomyopathy Drug Meets GoalsCytokinetics (CYTK) reports positive results from its pivotal late-stage study of aficamten in symptomatic obstructive hypertrophic cardiomyopathy patients. The stock rallies 83% in response. |
Biotech Stock Roundup: BMY's KRTX and RYZB Acquisition, CYTK Surges on Study DataBristol Myers (BMY) and Cytokinetics (CYTK) are in the news on acquisition announcements and study updates, respectively. |
Top 15 Value Stocks to Buy for 2024In this article, we discuss top 15 value stocks to buy for 2024 picked by Joel Greenblatt. To skip the details about Mr. Greenblatt’s life, portfolio performance, and investment strategy, go directly to Top 5 Value Stocks to Buy for 2024. Investing offers an exciting and effective way of growing wealth over time. Value investing is […] |
11 Hot Healthcare Stocks To Buy NowIn this article, we will be taking a look at 11 hot healthcare stocks to buy now. To skip our detailed analysis of the healthcare sector, you can go directly to see the 5 Hot Healthcare Stocks To Buy Now. Healthcare is a vital part of daily living for everyone, whether it be to cure […] |
Why Is Cytokinetics (CYTK) Stock Up 70% Today?With Cytokinetics hitting a homerun with its heart failure drug, CYTK stock skyrocketed in part due to takeover interest. |
BMY Price Returns
| 1-mo | -0.50% |
| 3-mo | 4.04% |
| 6-mo | -17.23% |
| 1-year | -27.12% |
| 3-year | -9.03% |
| 5-year | 14.59% |
| YTD | -1.70% |
| 2023 | -26.14% |
| 2022 | 18.98% |
| 2021 | 2.88% |
| 2020 | 0.41% |
| 2019 | 27.74% |
BMY Dividends
| Ex-Dividend Date | Type | Payout Amount | Change | ||||||
|---|---|---|---|---|---|---|---|---|---|
| Loading, please wait... | |||||||||
Continue Researching BMY
Here are a few links from around the web to help you further your research on Bristol Myers Squibb Co's stock as an investment opportunity:Bristol Myers Squibb Co (BMY) Stock Price | Nasdaq
Bristol Myers Squibb Co (BMY) Stock Quote, History and News - Yahoo Finance
Bristol Myers Squibb Co (BMY) Stock Price and Basic Information | MarketWatch
Loading social stream, please wait...