
AbbVie Inc. (ABBV): Price and Financial Metrics
ABBV Price/Volume Stats
| Current price | $177.49 | 52-week high | $178.92 |
| Prev. close | $176.59 | 52-week low | $130.96 |
| Day low | $176.07 | Volume | 6,689,900 |
| Day high | $178.92 | Avg. volume | 5,450,448 |
| 50-day MA | $162.13 | Dividend yield | 3.49% |
| 200-day MA | $148.40 | Market Cap | 319.48B |
ABBV Stock Price Chart Interactive Chart >

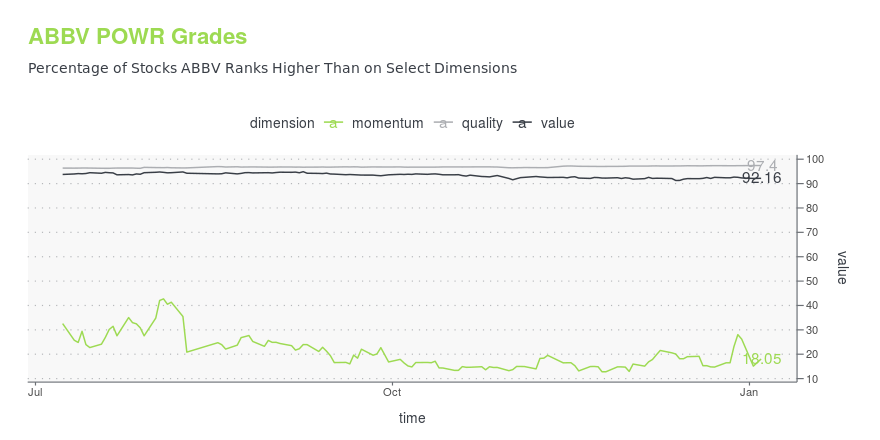
ABBV POWR Grades
- Quality is the dimension where ABBV ranks best; there it ranks ahead of 97.4% of US stocks.
- The strongest trend for ABBV is in Value, which has been heading down over the past 26 weeks.
- ABBV's current lowest rank is in the Momentum metric (where it is better than 18.05% of US stocks).
ABBV Stock Summary
- With a market capitalization of $283,298,134,574, ABBVIE INC has a greater market value than 99.4% of US stocks.
- Equity multiplier, or assets relative to shareholders' equity, comes in at 9.82 for ABBVIE INC; that's greater than it is for 89.62% of US stocks.
- In terms of volatility of its share price, ABBV is more volatile than merely 7.13% of stocks we're observing.
- Stocks with similar financial metrics, market capitalization, and price volatility to ABBVIE INC are ADBE, NFLX, CRM, CSCO, and SHEL.
- ABBV's SEC filings can be seen here. And to visit ABBVIE INC's official web site, go to www.abbvie.com.
ABBV Valuation Summary
- ABBV's price/sales ratio is 5; this is 127.27% higher than that of the median Healthcare stock.
- ABBV's price/sales ratio has moved up 1.8 over the prior 134 months.
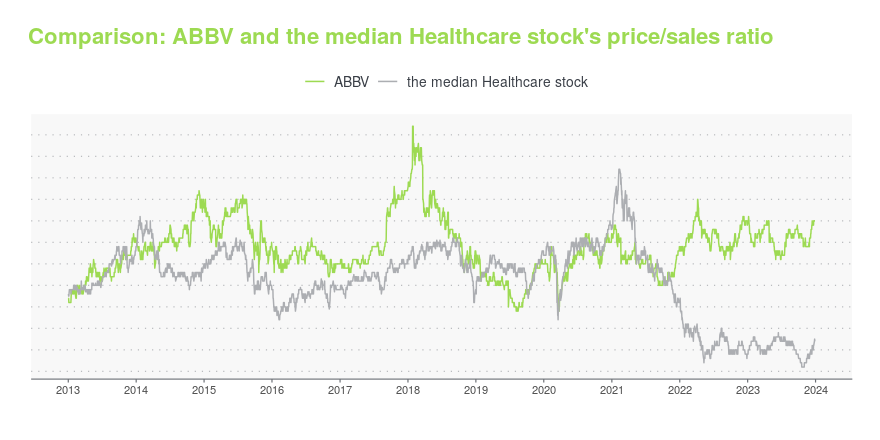
Below are key valuation metrics over time for ABBV.
| Stock | Date | P/S | P/B | P/E | EV/EBIT |
|---|---|---|---|---|---|
| ABBV | 2023-12-29 | 5.0 | 22.6 | 42.0 | 32.8 |
| ABBV | 2023-12-28 | 5.0 | 22.6 | 41.9 | 32.8 |
| ABBV | 2023-12-27 | 5.0 | 22.6 | 42.0 | 32.8 |
| ABBV | 2023-12-26 | 5.0 | 22.6 | 41.9 | 32.8 |
| ABBV | 2023-12-22 | 5.0 | 22.6 | 42.0 | 32.8 |
| ABBV | 2023-12-21 | 4.9 | 22.3 | 41.4 | 32.4 |
ABBV Growth Metrics
- Its 4 year price growth rate is now at 25.33%.
- Its 5 year net income to common stockholders growth rate is now at 33.69%.
- The year over year price growth rate now stands at 32.03%.
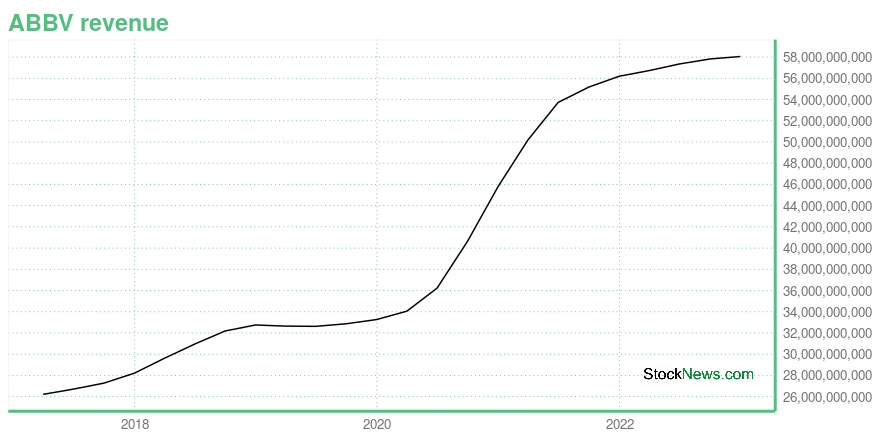
The table below shows ABBV's growth in key financial areas (numbers in millions of US dollars).
| Date | Revenue | Operating Cash Flow | Net Income to Common Stock |
|---|---|---|---|
| 2022-12-31 | 58,054 | 24,943 | 11,836 |
| 2022-09-30 | 57,819 | 22,590 | 13,407 |
| 2022-06-30 | 57,349 | 22,923 | 12,637 |
| 2022-03-31 | 56,725 | 22,808 | 12,479 |
| 2021-12-31 | 56,197 | 22,777 | 11,542 |
| 2021-09-30 | 55,169 | 22,556 | 7,534 |
ABBV's Quality Factors
The “Quality” component of the POWR Ratings focuses on 31 different factors of a companies fundamentals and operational strength. Here are some key insights as we drill into the specifics of these quality attributes.- ABBV has a Quality Grade of B, ranking ahead of 80.75% of graded US stocks.
- ABBV's asset turnover comes in at 0.369 -- ranking 131st of 682 Pharmaceutical Products stocks.
- PLXP, HSTO, and ADMP are the stocks whose asset turnover ratios are most correlated with ABBV.
The table below shows ABBV's key quality metrics over time.
| Period | Asset Turnover | Gross Margin | ROIC |
|---|---|---|---|
| 2021-09-30 | 0.369 | 0.677 | 0.119 |
| 2021-06-30 | 0.359 | 0.656 | 0.102 |
| 2021-03-31 | 0.335 | 0.648 | 0.078 |
| 2020-12-31 | 0.339 | 0.664 | 0.070 |
| 2020-09-30 | 0.339 | 0.687 | 0.131 |
| 2020-06-30 | 0.372 | 0.736 | 0.147 |
AbbVie Inc. (ABBV) Company Bio
Abbvie develops and markets therapies that address a range of diseases. The Company's products are focused on treating conditions, such as chronic autoimmune diseases, including rheumatoid arthritis, psoriasis and Crohn's disease, hepatitis C, human immunodeficiency virus, endometriosis, thyroid disease, Parkinson's disease, complications associated with chronic kidney disease and cystic fibrosis, and other health conditions, such as low testosterone. The company was founded in 2012 and is based in North Chicago, Illinois.
Latest ABBV News From Around the Web
Below are the latest news stories about ABBVIE INC that investors may wish to consider to help them evaluate ABBV as an investment opportunity.
The 3 Hottest Dividend Stocks to Watch in 2024You know what I hate about the typical article about hottest dividend stocks to watch? |
Top 15 Value Stocks to Buy for 2024In this article, we discuss top 15 value stocks to buy for 2024 picked by Joel Greenblatt. To skip the details about Mr. Greenblatt’s life, portfolio performance, and investment strategy, go directly to Top 5 Value Stocks to Buy for 2024. Investing offers an exciting and effective way of growing wealth over time. Value investing is […] |
AbbVie (ABBV) Laps the Stock Market: Here's WhyAbbVie (ABBV) closed at $154.88 in the latest trading session, marking a +0.17% move from the prior day. |
AstraZeneca (AZN) Set to Acquire Gracell for $1.2 BillionAstraZeneca (AZN) is set to acquire clinical-stage biopharmaceutical company, Gracell, for a total deal value of up to $1.2 billion. |
A Tale of Two Pharmas: Can Obesity Firms Continue Their Outperformance in 2024?In pharma, a company can take a larger slice of the healthcare pie than peers, but it is still constrained by the size of the pie. |
ABBV Price Returns
| 1-mo | 7.72% |
| 3-mo | 29.16% |
| 6-mo | 23.05% |
| 1-year | 22.05% |
| 3-year | 91.06% |
| 5-year | 179.51% |
| YTD | 15.63% |
| 2023 | -0.23% |
| 2022 | 24.01% |
| 2021 | 32.43% |
| 2020 | 27.72% |
| 2019 | 1.47% |
ABBV Dividends
| Ex-Dividend Date | Type | Payout Amount | Change | ||||||
|---|---|---|---|---|---|---|---|---|---|
| Loading, please wait... | |||||||||
Continue Researching ABBV
Want to do more research on AbbVie Inc's stock and its price? Try the links below:AbbVie Inc (ABBV) Stock Price | Nasdaq
AbbVie Inc (ABBV) Stock Quote, History and News - Yahoo Finance
AbbVie Inc (ABBV) Stock Price and Basic Information | MarketWatch
Loading social stream, please wait...